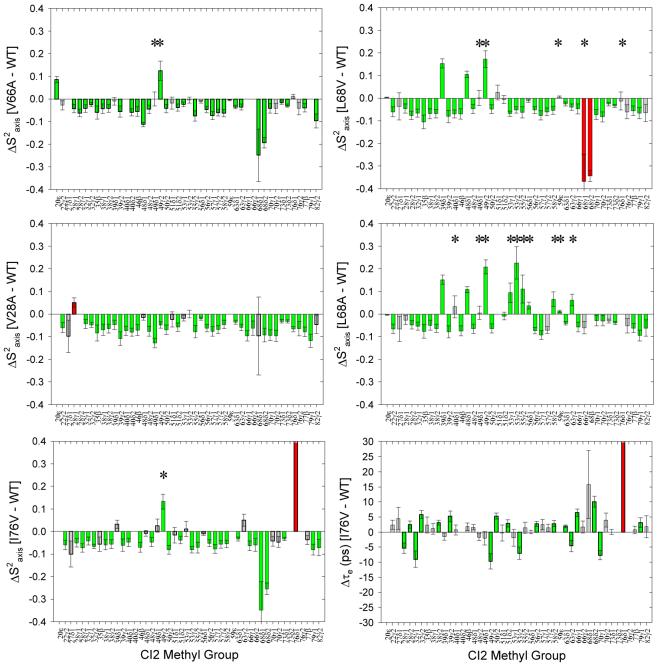
Figure 4.
2H relaxation analysis of changes in the amplitudes of methyl-containing side-chain motions (ΔS2axis) with respect to WT CI2 for the hydrophobic core mutants studied. Green bars represent significant changes (≥ 2σ). Red bars represent the site of mutation, if data are available. The asterisks denote methyl groups experiencing slower nanosecond-scale motions based on LS-3 model selection during fitting of the relaxation data.

