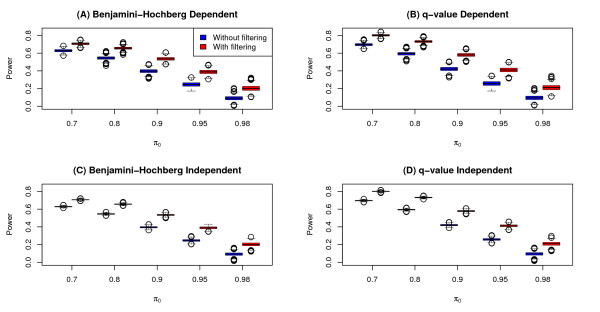
Figure 2.
Power results from simulation study. Boxplots of observed power of tests for differential expression (0.05 significance level) for simulation runs both with and without variance filtering. Plots (A) and (B) are boxplots for simulation scenarios with a "clumpy dependence" among genes using the Benjamini-Hochberg (BH) and q-value methods, respectively. Plots (C) and (D) are boxplots for simulation scenarios modeling independence among genes using the BH and q-value methods, respectively.

