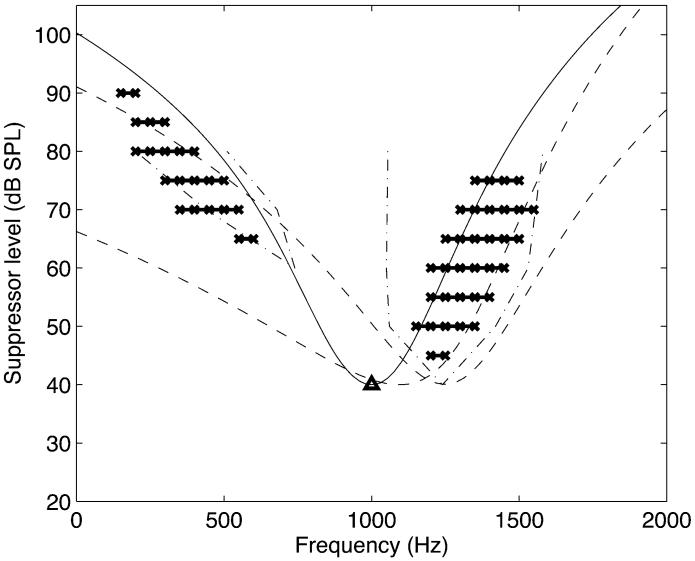
Fig. 4.
Simulation of two-tone suppression data. The probe tone is shown by the triangle. The suppression regions are shown with crosses. The dashed and dotted lines show the suppression regions observed psychophysically with the pulsation threshold technique [34]. The solid curve shows the filter shape of the cGC for the probe tone on its own. The dashed curves show the inverted frequency response curves of the pGC and cGC in the level estimation path, respectively.

