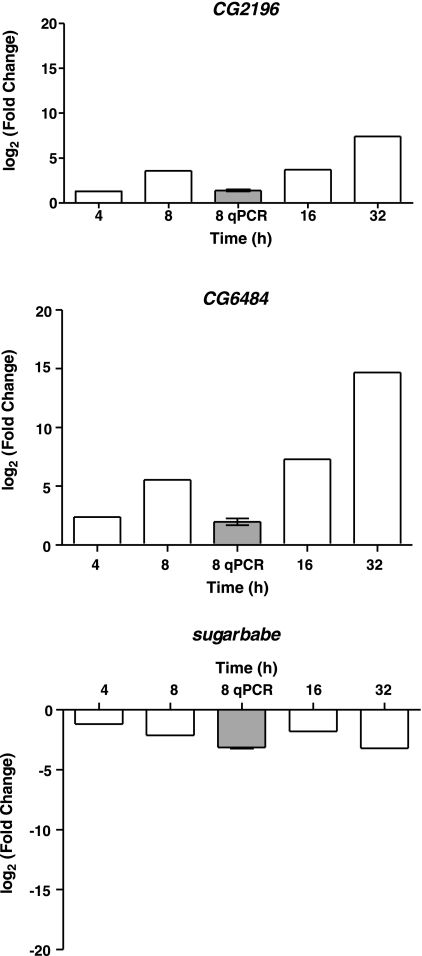
Fig. 3.
Time course of expression of selected genes and validation at 8 h. For each gene of interest (CG2196, sugarless, and CG6844), mean fold change (salt relative to normal diet) were plotted at 4, 8, 16, and 32 h. Bars with heavy lines are significantly different from no-change hypothesis at FDR <5%. Array fold changes are also compared with qPCR measurements (shaded boxes) at 8 h (means ± SE, n = 3; where error bars are not visible, they are too small to plot).

