Fig. 2.
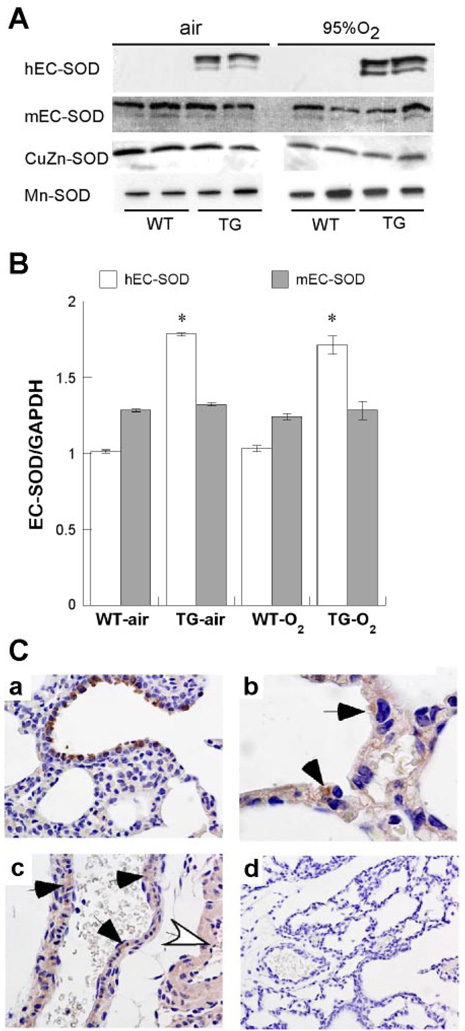
Effect of hyperoxia and TG EC-SOD on mouse (m) and human (h) EC-SOD expression. A: representative immunoblots detecting human and mouse EC-SOD, CuZn-SOD, and Mn-SOD. B: mean hEC-SOD or mEC-SOD mRNA real-time PCR signals at crossing point of amplification, normalized to glyceraldehyde-3-phosphate dehydrogenase (GAPDH) signal + SE, 8 pups/condition. *P < 0.05 vs. WT. C: mEC-SOD expression (A), airway, ×200; alveolar epithelium (B), arrows, ×1,000; and vascular smooth muscle (C) in small artery (black arrows) and large artery (white arrow), ×200. D shows control with no primary antibody, ×200.

