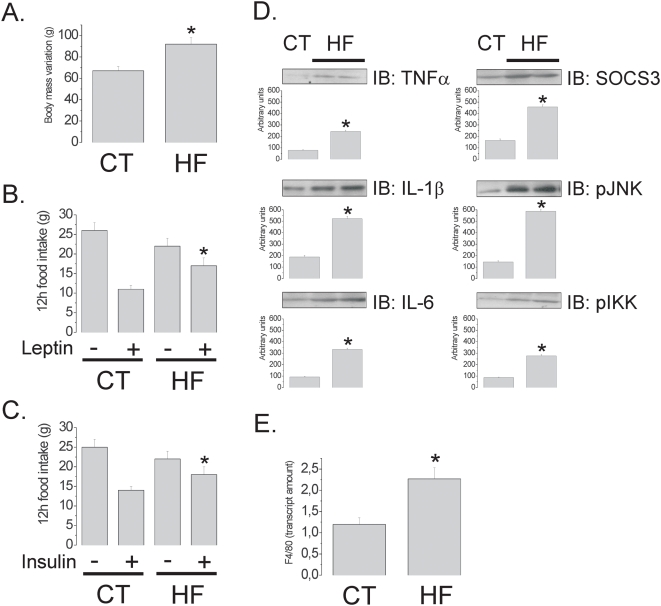
Figure 1. Leptin/insulin resistance and inflammatory markers in the hypothalamus of rats fed on high-fat diet.
(A) Body mass variation (g) of Wistar rats fed on control (CT) or high-fat (HF) diets for 8 w. (B–C) Twelve hours spontaneous food intake (g) of Wistar rats fed on CT or HF diets for 8 w and treated icv with a single dose (2.0 µl) of saline (−), leptin (+, in B) or insulin (+, in C). (D) Immunoblots (IB) of hypothalamic protein extracts obtained from Wistar rats fed on CT or HF diets. (E) Real-time PCR analysis of F4/80 transcript amount in samples obtained from the hypothalami of Wistar rats fed on CT or HF diets. In all experiments n = 5. In A, D and E, *p<0.05 vs. CT, values are means±SEM; in B and C, *p<0.05 vs. CT+, values are means±SEM.

