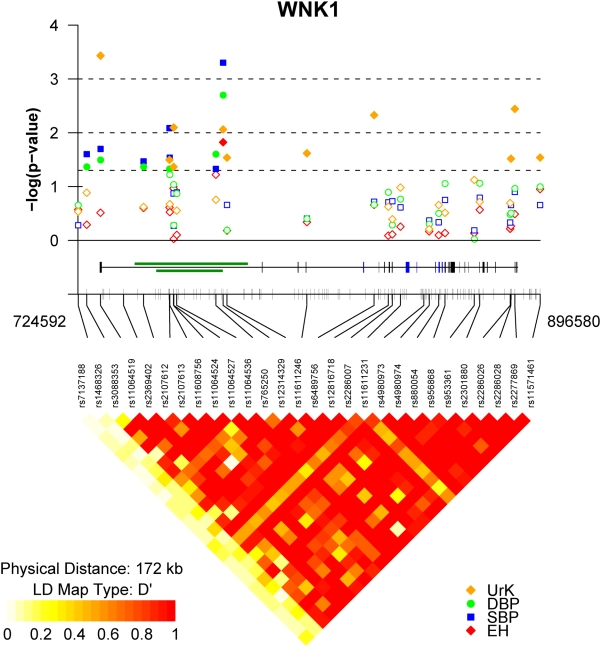
Figure 1. Association results and WNK1 linkage disequilibrium.
The diagram shows the summary results from the association analyses between WNK1 tSNPs and essential hypertension (EH – red diamonds), blood pressure variation (SBP – blue squares, DBP – green circles) and urine potassium excretion (UrK – orange diamonds). The −log(10) of the best p-value are plotted on the y-axis against the physical position or each genotyped tSNP (x-axis), denoted by their dbSNP identification. Dotted lines represent P-value thresholds. Closed symbols represent significant associations (p<0.05). The tick marks along the x-axis also show the physical position of all common HapMap. The middle panel shows the genomic structure of the human WNK1 gene and all known common variation across the WNK1 genomic region. Exons are indicated by the vertical black bars and alternatively spliced exons by the blue boxes. The green boxes indicate the position of the PHA2 disease causing deletions. The lower panel represents the extent of linkage disequilibrium as measured by Lewontin's |D′| across the WNK1 genomic region. |D′| varies between 0 (no disequilibrium) and 1 (maximum disequilibrium), represented by shades of white to yellow to red. White:|D′| = 0 and red:|D′| = 1. Strong LD (|D′|) exists between the most widely separated tSNPs, defining a single large haplotype block extending from tSNP 3 (rs3088353), located in the WNK1 promoter, to tSNP 28 (rs11571461) located 3′ of WNK1. The plot was produced using a modified version of snp.plotter [49].

