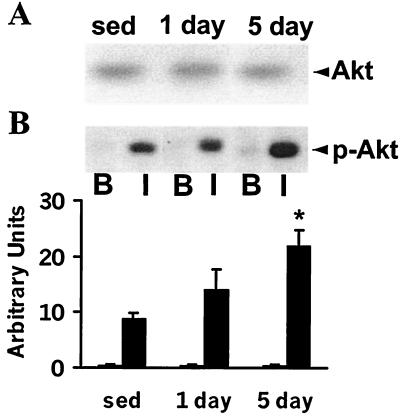
Figure 4.
Akt protein expression and phosphorylation. Muscles were incubated with or without 120 nM insulin (30 min). Muscle lysates (40 μg) were subjected to SDS/PAGE (10% gels) and immunoblotted with a polyclonal anti-Akt antibody (A: measuring expression) or a phospho-specific polyclonal anti-p-Akt antibody (B: measuring phosphorylation). A representative immunoblot of basal (B) and insulin-stimulated (I) Akt phosphorylation is shown. Graph is mean ± SEM for basal (open bar) and insulin-stimulated (filled bar) conditions for 5 or 6 rats. *, P < 0.05 vs. sedentary rats.

