
Figure 1. Analysis of blast colony development.
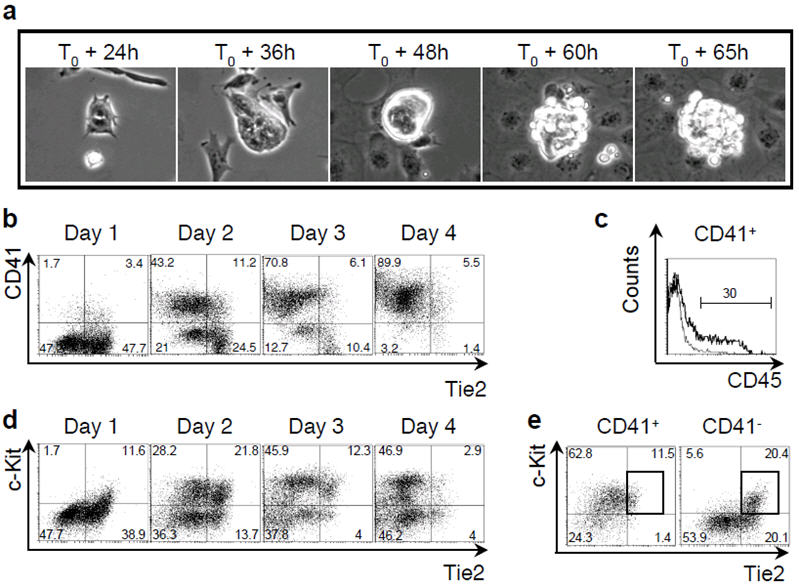
a) Phase contrast time-lapse pictures of blast colony development. b) FACS analysis of CD41 and Tie2 expression during blast colony development between day 1 and 4. c) CD45 expression of CD41+ cells at day 4 of blast colony culture. Line represents isotype control. d) FACS analysis of c-Kit and Tie2 expression during blast colony development. e) Tie2 and c-Kit expression of CD41+ (left) and CD41- (right) cells on day 2 of blast culture. Rectangles indicate Tie2hic-Kit+ population. Numbers represent percentages of respective populations.