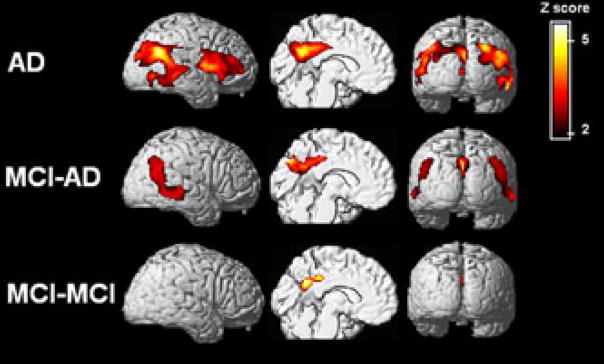
Figure 2.
Regional CMRglc reductions in AD patients (top row), individuals with MCI who declined to AD after 2 years (MCI–AD, middle row), and stable MCI patients (MCI–MCI, bottom row) compared with age-matched controls.65 Statistical parametric maps of reduced CMRglc are shown on a red-to-yellow color-coded scale reflecting Z scores between 2 and 6, and are displayed (from left to right) on the left lateral, left medial and posterior views of spatially standardized, volume-rendered MRI.

