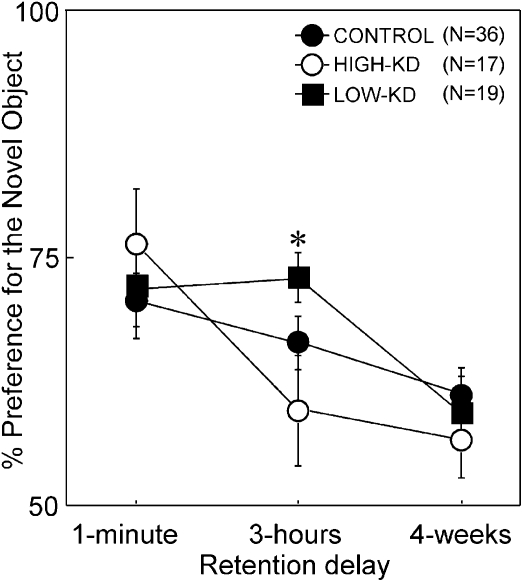
Figure 4.
Percentage of preference for the novel object across the 1-min, 3-h, and 4-wk delay intervals. Black circles represent the control group (n = 36), white circles represent the high-knockdown group (n = 17), and black squares represent the low-knockdown group (n = 19). Asterisk indicates impaired performance of the high-knockdown group relative to the low-knockdown group (P < 0.05).

