Figure 2.
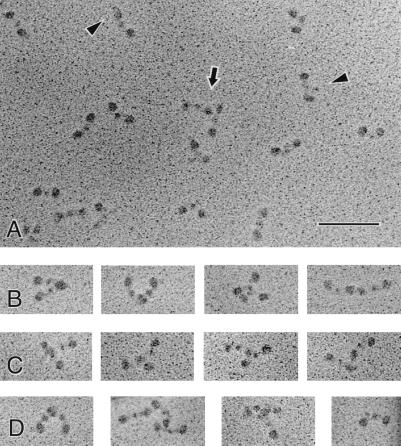
Electron micrographs of TG-modified molecules from the φx pool in Fig. 1. (A) A field of molecules, showing the variety of types of images that are present in a crosslinked sample, treated with dilute acetic acid so that the αC domains can be visualized. Most molecules are monomeric, although one dimer is present in the center (arrow). Monomers have the trinodular shape characteristic of fibrinogen, but many molecules appear to be slightly bent. In contrast to images of control fibrinogen in acetic acid, there are few αC domains visible, and almost no molecules have both αC domains visible. Also, some αC domains that are visible are closer to the ends of the molecules or other parts of the backbone (arrowheads), rather than their typical position farther from the backbone. (Bar = 100 nm.) (B–D) A gallery of images illustrating some typical oligomers observed. There appears to be a great deal of flexibility in the linkage between dimers, because a wide variety of different orientations of the molecules is present. Many molecules lie side-by-side with the ends of the two molecules near each other and a variable angle between their backbones. A few are end-to-end but oriented more linearly, like fibrin(ogen) crosslinked by Factor XIIIa, but in this case there is sometimes a larger gap between the ends. Some dimers are oriented end-to-center or have an end adjoining the connector between the center and end of the other molecule. (D, far right) Another example of a molecule with its αC domain close to the molecular backbone.

