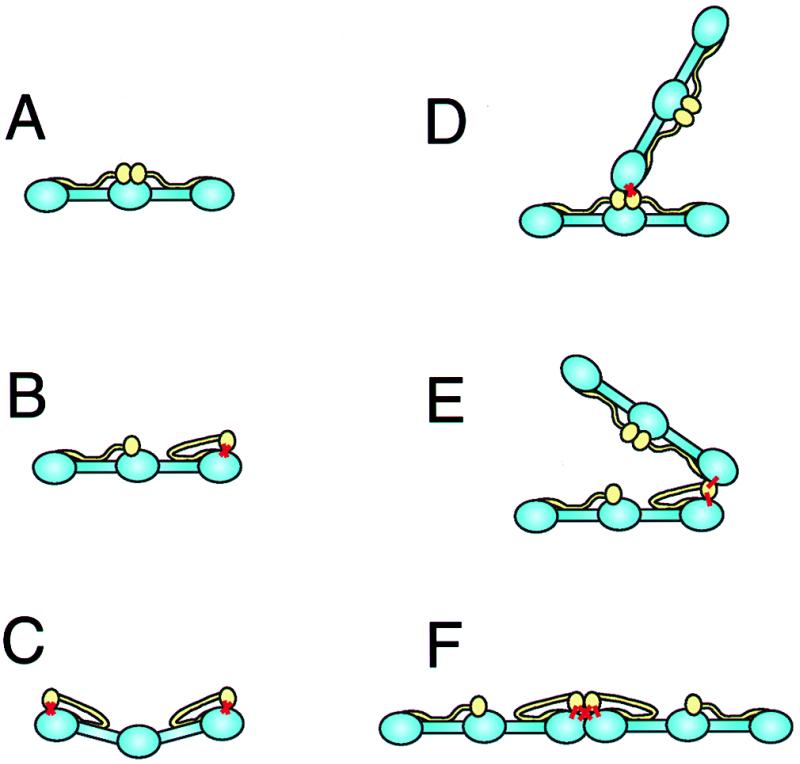
Figure 3.

Schematic representation of intramolecular and intermolecular crosslinking of fibrinogen by TG, based on the appearance of molecules in the electron micrographs of Fig. 2. The main backbone of the fibrinogen molecules are blue while the αC domains are yellow. (A) Control fibrinogen. The αC domains are in the central region of the molecule. (B) Fibrinogen with one αC domain crosslinked intramolecularly to one γ chain. The sites of the crosslinks are indicated by thick red lines. The αC domain has dissociated from the central domain and is attached to the end of the molecule, where the C-terminal γ chain is located. (C) Fibrinogen with each αC domain crosslinked intramolecularly to one γ chain. The molecule is slightly bent, as observed in the electron micrographs, because of the strains introduced. (D) Fibrinogen with one αC domain crosslinked intermolecularly to the γ chain of another molecule. In this case, neither molecule has an intramolecular Aα:γ crosslink, so that the two molecules are oriented end-to-center. (E) Fibrinogen with one αC domain crosslinked intermolecularly to the γ chain of another molecule. In this case, one molecule has an intramolecular Aα:γ crosslink, so that the two molecules are oriented end-to-end. There is a great deal of flexibility in these junctions, allowing the two molecules to be oriented in a variety of ways. (F) Fibrinogen with one αC domain crosslinked intermolecularly to the γ chain of another molecule. In this case, both molecules have intramolecular Aα:γ crosslinks, so that the two molecules are oriented end-to-end. In addition, the molecules are constrained to a linear arrangement because of two intermolecular Aα:γ crosslinks.
