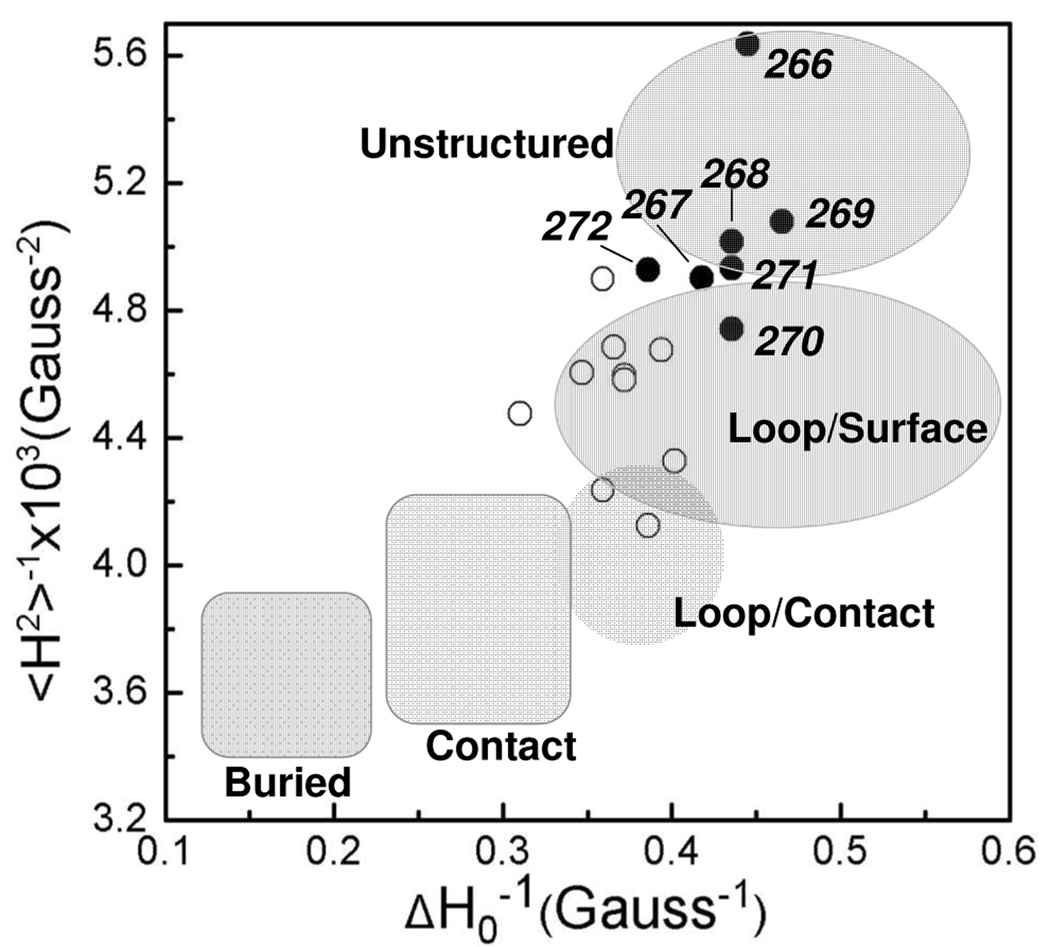
Figure 4.
Plot of the reciprocal of the central linewidth (ΔH0−1) versus the reciprocal of the second moment (<H2>−1) of the EPR spectrum for the labeled sites in syt1C2AB. Residues that make up the flexible portion of the linker, 266–272, are plotted with solid circles. The open circles represent sites outside the linker and in the 8th β-strand of C2A. Many sites within the linker have spectral characteristics of an unstructured protein segment; other sites in the linker resemble those in very dynamic loop segments. The shaded areas correspond to those defined previously, based upon EPR lineshapes from R1 at sites in proteins of known structure (42).

