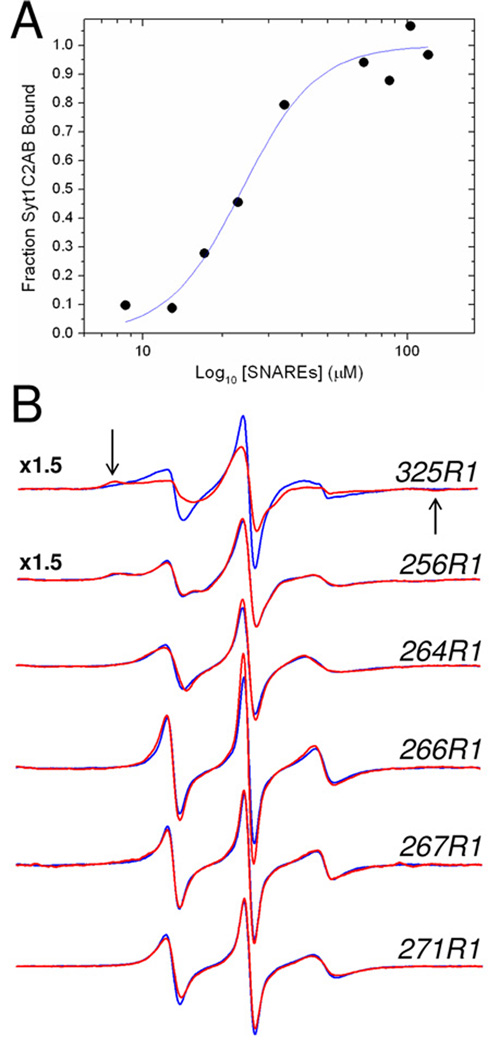
Figure 7.
A) Titration of the fraction of syt1C2AB bound to SNAREs as a function of the concentration of added soluble SNARE complex. The fraction of bound label was determined using Eq. 4. The fit to the data was made using a standard Hill Equation, and yield an affinity of 24 µM. A slight apparent cooperativity is found in this binding with n=2. In this titration, the concentration of syt1C2AB was held constant at 23 µM with a Ca2+ concentration of 1 mM. B) EPR spectra of single R1 substitutions in the absence (blue trace) or presence (red trace) of 120 M SNARE complex in the presence of 1 mM Ca2+. Site 325 is located in the C2B domain and is likely at a site that is involved in tertiary contact with the SNAREs. The arrows indicate the position of the hyperfine extrema in this spectrum. Site 256 lies within the 8th β-strand in the C2A domain, and sites 264, 266, 267 and 271 lie within the linker connecting C2A and C2B. The amplitudes of these EPR spectra are normalized against the second integral of the EPR spectrum and are expanded by a factor of 1.5 for 325R1 and 256R1.

