
Figure 1. Prostaglandin Transporter (PGT) expression in different regions of murine CNS.
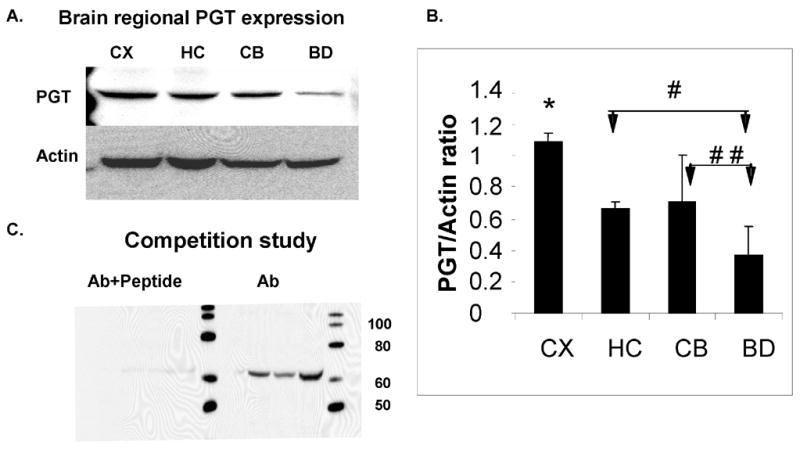
(A). Immunoblot analysis of PGT expression in the CD-1 P30 mouse CNS at P30. Actin serves as a loading control. (B) Densitometric analyses of PGT expression in mouse CNS. Brain regions are plotted on the X axis vs. optical density of PGT to actin on the Y axis. (CX=cortex; HC= hippocampus; CB=cerebellum; BD=brainstem/diencephalon). Values are means ± SE. The asterisk (*) indicates that there are significant differences between the CX and the other 3 regions (HC, CB and BD) (p< 0.0001), the single pound sign (#) indicates that there is a significant difference between the HC and BD (p< 0.0005) and the double pound sign (# #) indicates that there is a significant difference between the CB and BD (p< 0.007). (C). Competition Study: immunoblot analyses of PGT antibody and peptide (left) and antibody alone.