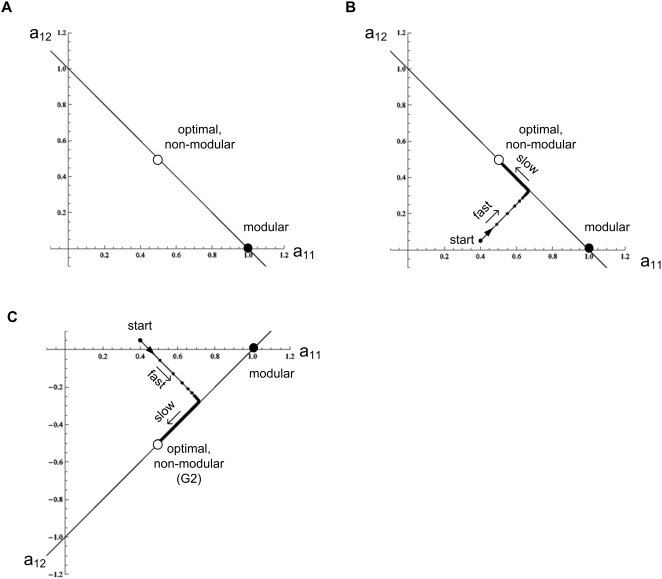
Figure 4. Dynamics of evolution under a constant goal.
(A) Matrix elements are portrayed in a two dimensional space defined by a11 and a12, the first row elements of the matrix A. The goal is G1 = [v = (1,1), u = (1,1)], empty circle: optimal non-modular solution (0.5, 0.5). Full circle: modular solution (1,0). The line a12 = 1−a11 represents all configurations that satisfy the goal (satisfy Av = u). (B) A typical trajectory under the constant goal G 1. Black dots display the dynamics at 100/r time unit resolution, where r is the rate in Eq. 4. (C) Same as (B) for the goal G2 = [v = (1,−1), u = (1,−1)].

