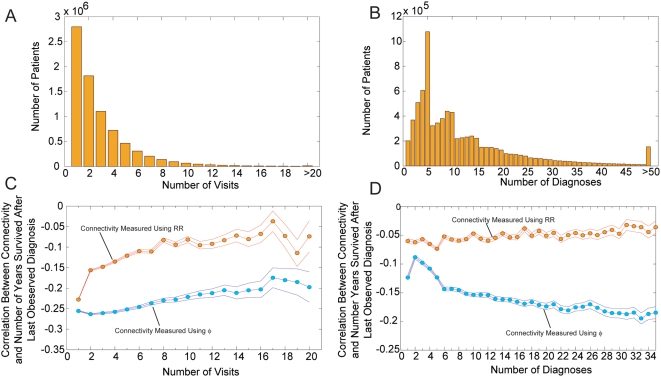
Figure 5. Connectivity lethality control.
A. Histogram with the number of visits for each patient for which the year of death is known. B. Histogram for the number of diagnosis assigned to each patient for which the year of death is known. C. Correlation between the average connectivity of the diagnosis assigned to a patient and the number of years survived after the last diagnosis was recorded for groups of patients with the same number of hospital visits. D. Correlation between the average connectivity of the diagnosis assigned to a patient and the number of years survived after the last diagnosis was recorded for groups of patients with the same number of total number of diagnosis assigned. Error margins in C and D represent 95% confidence intervals.

