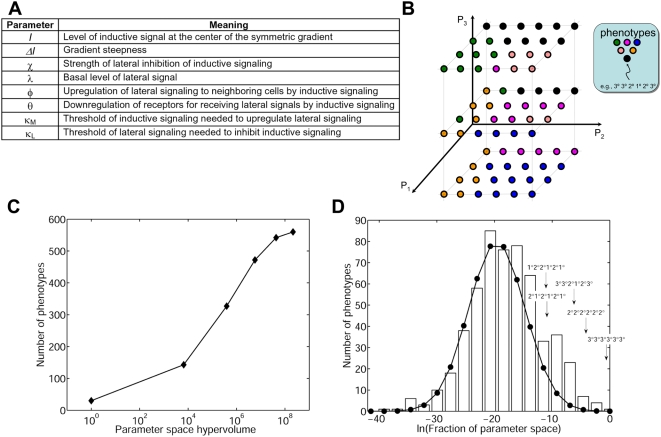
Figure 2. The predicted phenotypic diversity accessible to the vulval developmental network.
(A) Model parameters. The model has eight dimensionless parameters associated with the various molecular interactions known to contribute to the specification of vulval precursor cells (see also Materials and Methods). (B) Schematic of the phenotype phase diagram. This diagram portrays a simplified, three-dimensional version of the 8-dimensional phenotype phase diagram. Each axis represents a model parameter. Each point in parameter space yields a specific multicellular phenotype, such as the wild-type (3°3°2°1°2°3°, black). (C) The total number of predicted phenotypes eventually saturates as the volume of the parameter space is expanded. (D) Distribution of parameter space occupancy (PSO). A histogram depicting the number of phenotypes (bars) occupying different fractions of the parameter space. This histogram is compared to a log-normal distribution (filled circles). The arrows indicate the PSO values of some experimentally observed phenotypes.

