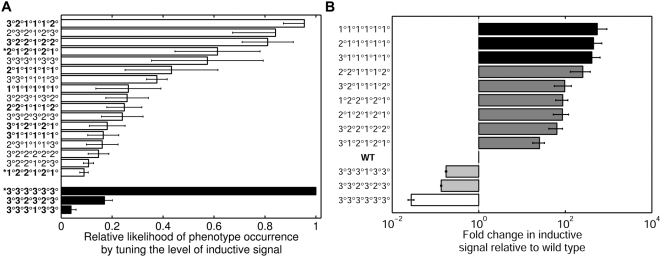
Figure 5. The hierarchy of phenotypes predicted to occur through quantitative changes in morphogen level.
(A) The relative probability (x-axis) of reaching different mutant phenotypes (y-axis) upon decreasing (filled bars) or increasing (open bars) the amount of LIN-3 morphogen. The predicted phenotypes denoted with an asterisk are ones observed experimentally in C. elegans. Bold-faced phenotypes correspond to multicellular patterns observed experimentally in the three major species of the Caenorhabditis genus (see Figure 6A). (B) The predicted fold change in inductive signal (x-axis) necessary to convert the wild-type phenotype into underinduced phenotypes (Fold change <1) and over-induced phenotypes (Fold change >1). The phenotypes listed on the y-axis correspond to the bold-faced phenotypes in panel (A). The list has been re-sorted according to the required fold change in inductive signal. The shading of bars corresponds to the shading of experimentally observed phenotypes in Figure 6A.

