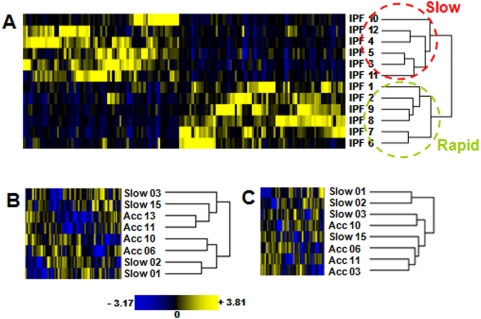
Figure 4. Heat map SAGE molecular signature.
(A) Unsupervised clustering of gene expression patterns of IPF lung SAGE libraries described in Table S1, based on the expression signature of 134 transcripts showing a clear distinction between relatively stable (slow) and progressive (rapid) IPF. (B–C) Hierarchical clustering of 8 IPF samples previously identified as a slow and accelerated variants [13] based on 90 (B) or 58 (C) genes in common with the SAGE 134 molecular signature.

