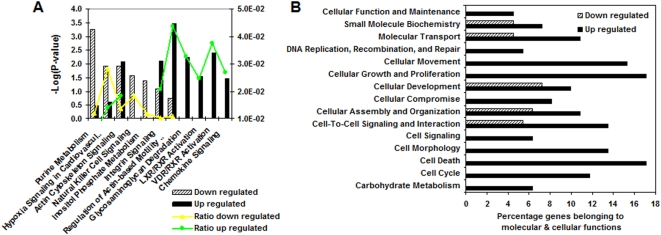
Figure 5. Biological differences between progressive and relatively stable disease groups in IPF.
(A) Ingenuity Canonical Pathway analysis showing the most significant pathways associated with the datasets of up and down regulated genes in the progressive group. The significance of the association between the dataset and the canonical pathway was measured as a ratio (number of genes from the dataset that map to the pathway divided by the total number of molecules that exist in the canonical pathway). A Fischer's exact test was used to calculate a P-value. (B) Main molecular and cellular functions significantly associated with the datasets of up and down regulated genes in the progressive group according to the IPA functional analysis tool.

