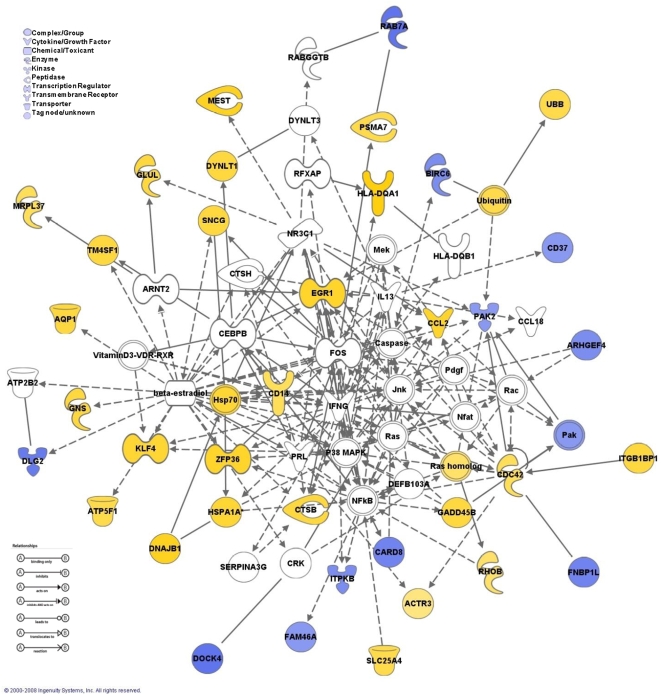
Figure 6. Network analysis.
The network map represents the interaction between members of two networks highlighting the crosstalk between the multiple differentially expressed genes in the progressive group. Nodes represent genes, and theirs shapes represent the functional classes of the gene products. Solid lines indicate a direct interaction and dashed lines indicate an indirect interaction.

