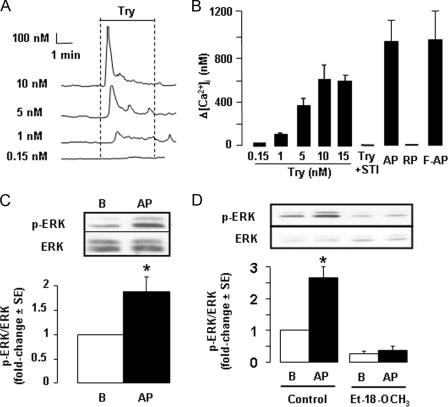
FIGURE 1.
PAR2 signaling in rat cTAL. A, representative traces showing changes in [Ca2+]i (Δ[Ca2+]i) in cTAL, determined by fura 2-AM fluorescence, in response to basolateral addition of different concentrations of trypsin (Try). B, comparative effects on [Ca2+]i of different concentrations of Try, 40 μm PAR2 AP, 40 μm inactive RP, 10 μm F-AP, or 20 nm soybean trypsin inhibitor and 10 nm trypsin (Try +STI). Data are means ± S.E. from 4–6 experiments. C, representative immunoblot and mean increase in the phosphoERK (p-ERK)/ERK ratio on cTAL incubated for 10 min at 37 °C under basal conditions (B) or in the presence of 40 μm PAR2 AP. Values are means ± S.E. from 8 experiments. *, p < 0.001 as compared with basal condition by Student's t test. D, same as in C in cTALs preincubated 45 min at 30 °C in the absence (control) or presence of 150 μm PLC inhibitor Et-18-OCH3. Values are means ± S.E. from 4 experiments. *, p < 0.001 as compared with basal by Student's t test.

