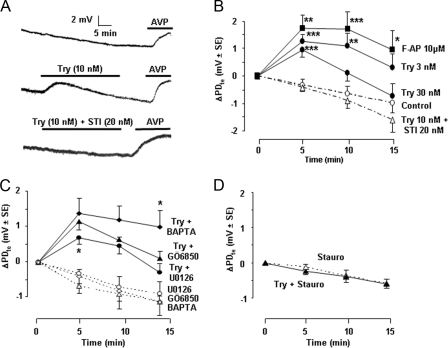
FIGURE 2.
Activation of PAR2 increases transepithelial voltage in rat cTAL. A, representative traces showing the spontaneous variations of PDte as a function of time (top trace) and the effect of Try (10 nm) addition to the bath in the absence (middle trace) or presence of soybean trypsin inhibitor (STI, 20 nm, bottom trace). The viability of each cTAL at the end of the experimental period was attested by the hyperpolarizing effect of the addition of 0.2 nm AVP to the bath. B, mean variation of PDte (ΔPDte) calculated 5, 10, and 15 min after the addition of Try or F-AP or in time control tubules. Values are means ± S.E. from 4–6 cTALs. Statistically significant differences between treated and time control cTALs: *, p < 0.025; **, p < 0.01; ***, p < 0.005. C, ΔPDte, calculated as above, after the addition of trypsin (10 nm, full lines) or in time controls (stippled lines) in cTALs pretreated with BAPTA (10–20 μm, 1 h at room temperature before mounting in microperfusion chamber), GÖ6850 (100 nm, for at least 35 min during PDte equilibration period), or U0126 (10 μm, for at least 35 min during the PDte equilibration period). Values are means ± S.E. from 4–6 tubules. Statistically significant differences versus trypsin alone: *, p < 0.025. D, same as in C in cTALs pretreated with staurosporine (Stauro, 15 nm, for at least 35 min during PDte equilibration period).

