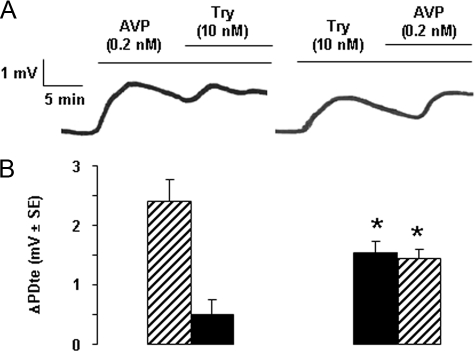
FIGURE 3.
Comparative effects of activation of PAR2 and vasopressin V2 receptor on transepithelial voltage in rat cTAL. A, representative traces showing the effect on PDte of the successive addition of vasopressin (AVP, 200 pm) followed by Try (10 nm)(left trace) or trypsin followed by AVP (right trace). B, mean variation of PDte, calculated between the PDte values at the peak response and at the time of trypsin (dark columns) or AVP (hatched columns) addition. Left panel, the addition of AVP followed by trypsin; right panel, the addition of trypsin followed by AVP. Values are means ± S.E. from 5–6 cTALs. *, p < 0.01 between the two experimental series.

