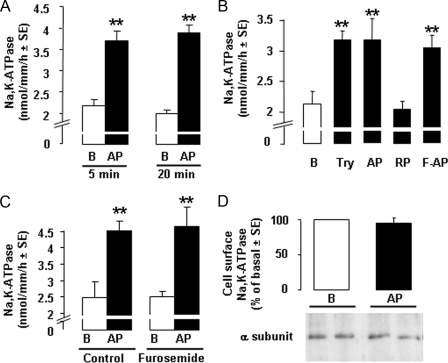
FIGURE 4.
Activation of PAR2 stimulates Na,K-ATPase Vmax in the rat cTAL. A, Na,K-ATPase Vmax in cTAL incubated under basal conditions (B, open columns) or with 40 μm PAR2 AP (dark columns) for 5 or 20 min. Values are means ± S.E. from 4 (20 min) and 13 (5 min) animals. **, p < 0.001 as compared with basal. B, representative experiment showing Na,K-ATPase Vmax in cTAL incubated for 5 min at 37 °C in basal condition B or in the presence of 10 nm Try, 40 μm PAR2 AP, 40 μm inactive RP, or 10 μm F-AP. **, p < 0.001 as compared with basal. C, Na,K-ATPase activity in cTALs incubated for 5 min at 37 °C with or without 40 μm AP (B and AP, respectively) in the absence (Control) or presence of 100 μm furosemide. Values are means ± S.E. from 3 experiments. **, p < 0.001 as compared with basal. D, representative immunoblot and mean change in plasma membrane expression of Na,K-ATPase α subunit in cTAL incubated for 10 min at 37 °C under basal conditions (B) or in the presence of 40 μm PAR2 AP. Membrane Na,K-ATPase was quantified by Western blotting after biotin labeling and streptavidin precipitation. Values are means ± S.E. from 4 experiments.

