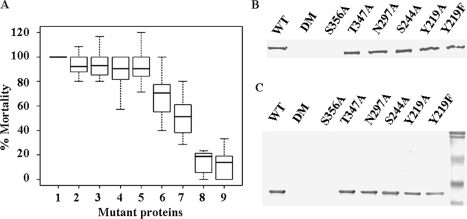
FIGURE 7.
Effect of mutations on bioactivity of XnGroEL. A, box plot of percent toxicity (y axis), normalized relative to wild type scores. 1, wild type; 2, S244A; 3, N297A; 4, Y219A; 5, Y219F; 6, T347A; 7, S356A; 8, double mutant; 9, EcGroEL. The thick bar represents percent medians for different proteins. The box includes range of scores falling into the middle 50% of the distribution (interquartile range (IQR) = 75th–25th percentile), and the whiskers are the minimum and maximum scores in the distribution, mathematically defined as (±1.5 IQR) upper and lower fences. B, binding of XnGroEL and mutated proteins to BBMV. WT, wild type; DM, double mutant. C, binding and detection of apical domain and corresponding domain variants. Protein binding was detected as described in Fig. 5.

