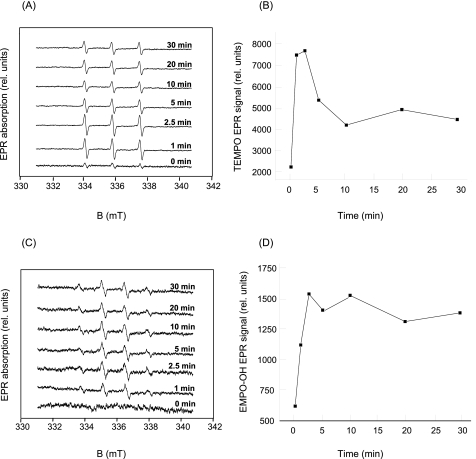
FIGURE 3.
Detection of reactive oxygen species in the heat-treated PS II membranes. A, TEMPO EPR spectra measured in the PS II membranes heated at 40 °C for the periods indicated in the figure. TEMPO spectra were measured in the presence of 50 mm TEMP, 5% ethanol, 500 μg of chlorophyll ml-1, and 40 mm MES (pH 6.5). B, time profile of a TEMPO EPR signal measured in the PS II membranes heated at 40 °C. TEMPO EPR signal was determined as the relative height of the central peak of the first derivative of the absorption spectra. C, EMPO-OH adduct EPR spectra measured in the PS II membranes heated at 40 °C for the periods indicated in the figure. EMPO-OH spectra were measured in the presence of 75 μm EMPO, 500 μg of chlorophyll ml-1, and 40 mm MES (pH 6.5). D, time profile of EMPO-OH adduct EPR signal measured in the PS II membranes heated at 40 °C. EMPO-OH adduct EPR signal was determined as the relative height of the central doublet of the first derivative of absorption spectra. B and D, for longer periods of heat treatment, the spin trap-radical adduct EPR signals decline because of the instability of spin trap-radical adduct.

