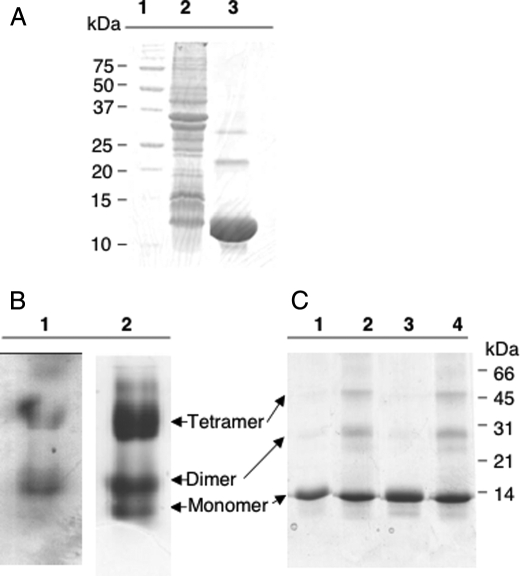
FIGURE 1.
Electrophoretic characterization of NfuA. A, lane 1, molecular mass markers whose masses are indicated at the left; lane 2, whole cell extract of E. coli cells overexpressing nfuA; lane 3, apo-NfuA purified by metal chelation chromatography. B, native gel electrophoresis of reconstituted NfuA under anoxic conditions. Lane 1, holo-NfuA stained for iron; lane 2, holo-NfuA stained with Coomassie Blue. C, SDS-PAGE analyses of holo-NfuA with and without alkylation and cross-linking with EDC. Lane 1, holo-NfuA; lane 2, holo-NfuA cross-linked with EDC; lane 3, holo-NfuA treated with iodoacetamide; lane 4, holo-NfuA cross-linked with EDC and then treated with iodoacetamide.

