FIGURE 2.
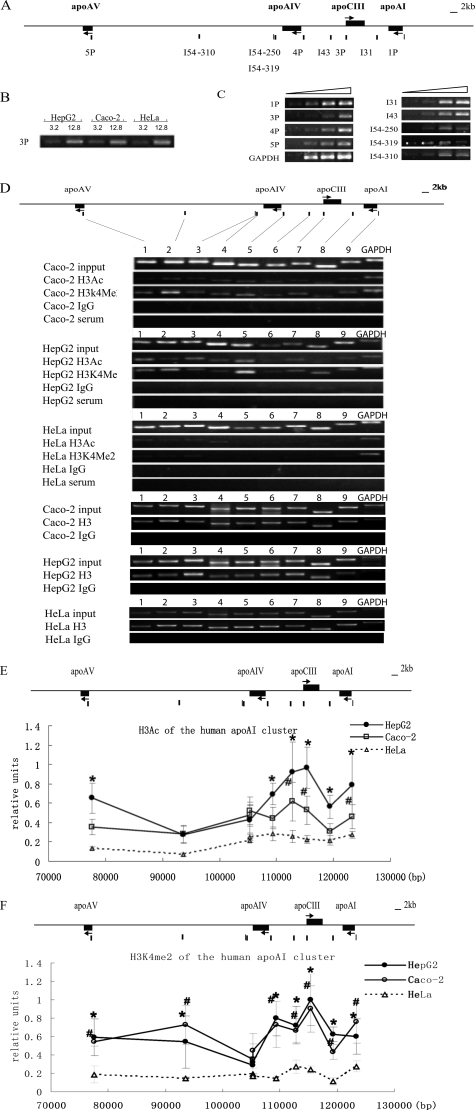
Histone H3 acetylation and H3K4 dimethylation pattern of the apoAI gene cluster in HepG2, Caco-2 and HeLa cells. A, the primer locations on the apoAI cluster. The primer pairs of 1P, 3P, 4P, and 5P represent the promoter sites of apoAI, apoCIII, apoAIV, and apoAV, respectively. The primer pairs of I54, I43, and I31 represent the sites in the intergenic regions. B, the concentrations of input DNA in different cells were adjusted to the same level and verified by PCR with the primer 3P. C, PCR conditions for each primer pair. PCR was performed with 4-fold serial dilution of input DNA. Each primer was in the linear amplification range. D, representative ethidium bromide-stained gels of ChIP assay are shown. Lanes 1–9 represent the PCR results from the sites of 5P, I54–310, I54–319, I54–250, 4P, I43, 3P, I31, and 1P on the apoAI cluster respectively. Total histone H3 served as an internal control, and rabbit serum and IgG were used as negative controls. The results are shown as the means ± S.D. of at least three independent PCRs. Compared with HeLa, p < 0.05 for difference from HepG2 values (*), and p < 0.05 for difference from Caco2 values (#). Ac, acetylated histone H3. Me, dimethylated histone H3K4. E, histone H3 acetylation pattern of the apoAI cluster in cells. F, histone H3K4 dimethylation pattern of the apoAI cluster in cells.

