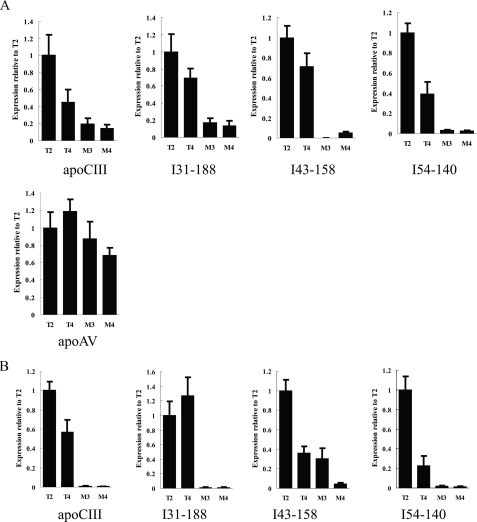
FIGURE 5.
Comparing the levels of intergenic transcripts between the mutant and the intact transgenic mice. A, intergenic transcripts in the liver of transgenic mice. B, intergenic transcripts in the intestine of transgenic mice. Mouse glyceraldehyde-3-phosphate dehydrogenase served as an internal control, and the results in the histogram were normalized to the expression of transgenic mouse line T2. M3 and M4 represent the apoCIII enhancer-deleted transgenic mice. T2 and T4 represent the intact human apoAI gene cluster transgenic mice.

