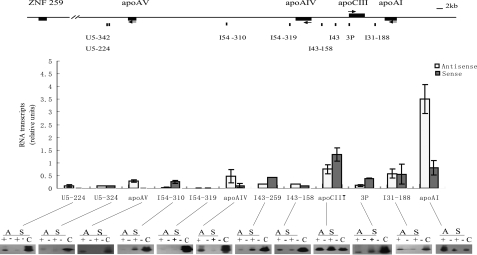
FIGURE 6.
Bidirectional transcriptions along the apoAI gene locus with strand preferences. Each RT reaction was performed using a sense or an antisense specific primer from the relevant amplimer set (as in Fig. 4). Strand-specific RT reactions were followed with PCRs corresponding to the primer sites indicated above. The results were quantified by Southern blot hybridization with unique sequence probes and calculated. The results are shown as the means ± S.D. of at least three independent PCRs. Representative data for the transcriptional orientation are shown at the bottom of the histogram. Amplification products are shown in the presence (+) and absence (-) of reverse transcriptase, and the polarity of the initial strand-specific RT primer, antisense (A) or sense (S), is indicated. The control PCR was optimized into linear amplification range, and 0.008 ng of apo BAC plasmid DNA was used as the template (C) for determining the relative levels of antisense and sense transcripts along the apoAI gene cluster.

