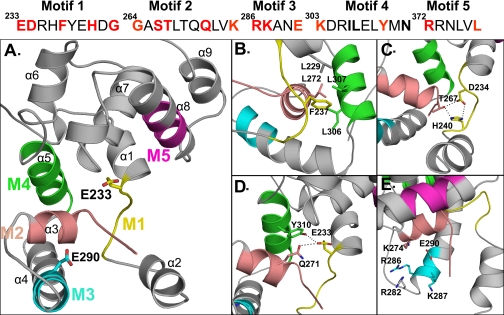
FIGURE 3.
Structural model of PBP1b GT module (212–398) and close view into the catalytic site depicting the positions of the studied conserved residues in sticks. A, motif 1 (M1) is shown in yellow, motif 2 (M2) is shown in salmon, motif 3 (M3) is shown in cyan, motif 4 (M4) is shown in green, and motif 5 (M5) is shown in magenta. The catalytic Glu233 and the Glu290 residues are shown in sticks. B, Phe237 is part of a hydrophobic cluster. C, interaction between Asp234 and His240 of motif 1 and Thr267 of motif 2. D, Gln271 and Tyr310 are within interacting distance of the catalytic Glu233. E, positively charged residues within the donor site close to the Glu290 are shown. The figures were generated with the help of the PyMOL software.

