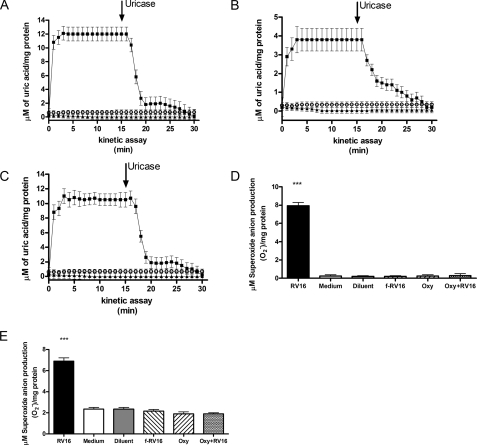
FIGURE 2.
XO involvement in rhinovirus-induced cytosolic superoxide anion
( ) production.
A (n = 5) and B (n = 5), uric acid
production kinetics in confluent A549 cells and HBEC, respectively. Cells were
exposed to live RV16 (squares), RV16 physically removed by filtration
(triangles), or medium alone (open circles). The
arrow indicates when uricase was added to the system. Newly generated
uric acid was measured spectophotometrically in each sample and expressed as
micromolar and normalized per mg of protein. C, uric acid production
in A549 exposed to minor group rhinovirus RV1B (live RV1B (squares),
RV1B physically removed by filtration (triangles), or medium alone
(open circles)) (n = 5). D (n = 5) and
E (n = 5), A549 cells (D) and HBEC (E)
were exposed for 1 h to live RV16 (RV16), RV16 physically removed by
filtration (f-RV16), medium alone (Medium), or diluent alone
(Diluent). Where indicated cells were pretreated 4 h before the
infection with oxypurinol and than exposed for 1 h to medium alone
(Oxy) or RV16 (Oxy+RV16) (***,
p < 0.001 versus medium, diluent, f-RV16, Oxy-treated
cells and versus RV16-infected cells pretreated with Oxy).

