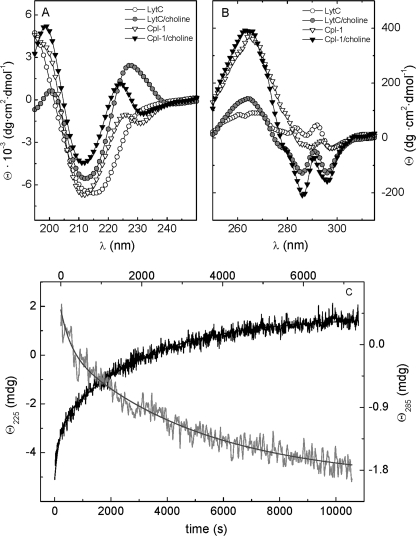
FIGURE 2.
CD spectra of lysozymes LytC and Cpl-1. Influence of choline binding. A and B depict, respectively, the far and near UV spectra of LytC (circles) and Cpl-1 (triangles) in the absence and in the presence of 140 mm choline (Pi buffer) recorded at 25 °C (Cpl-1) and 4 °C (LytC). C, the kinetics of choline binding to LytC following ellipticity variations at 225 nm (black trace) and 285 nm (gray trace; top scale). Measurements were made in Pi buffer at 4 °C and 140 mm choline.

