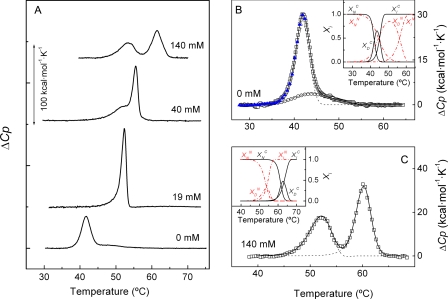
FIGURE 4.
Influence of choline concentration on the DSC transitions of Cpl-1.
A, influence of choline on the calorimetric profiles of Cpl-1
lysozyme (55 μm). Measurements were done in Pi buffer
at the ligand concentrations indicated in the curve labels. B and
C show, respectively, the analysis of Cpl-1 thermograms in the
absence and in the presence of 140 mm choline, assuming a
three-state N ↔ D → I denaturation model for each module (heating
rate 20.4 °C/h). Symbols correspond to the experimental curves,
and solid and dashed lines are, respectively, the best fits
of the curves and the individual transitions under the envelope calculated
using the parameters summarized in supplemental Table 2. Open circles
in B show the DSC transition evolved by a sample of Cpl-1 previously
heated up to 42.5 °C (blue triangles), corresponding to the CM
denaturation. For clarity, one data point of four is plotted on average,
although full data sets were used for fitting. Insets in B
and C show the population of the native, reversibly, and irreversibly
denatured states as a function of temperature. The red lines
correspond to the CM denaturation
( ,
,
 ,
,
 ), and the black
ones correspond to the CBM denaturation
(
 ,
,
 and
and
 ).
).

