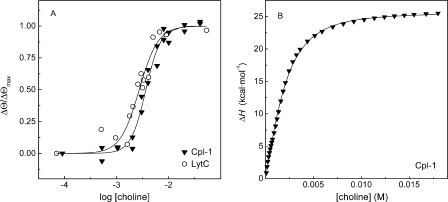
FIGURE 5.
Choline binding to LytC and Cpl-1 lysozymes. A depicts the logarithmic plot of the CD titration curves of LytC (4 °C) and Cpl-1 (25 °C) measured by monitoring the ellipticity changes promoted by ligand binding. The solid lines are the best fits of the Hill equation, assuming a single set of binding sites. B shows the isothermal titration calorimetry titration curve of Cpl-1 with choline (25 °C) represented as the cumulative enthalpy of binding versus the total ligand concentration. The solid line represents the fit of the experimental data in terms of equilibria shown in Scheme 1 (see “Experimental Procedures”) and the thermodynamic parameters reported in Table 4. All measurements were in Pi buffer.

