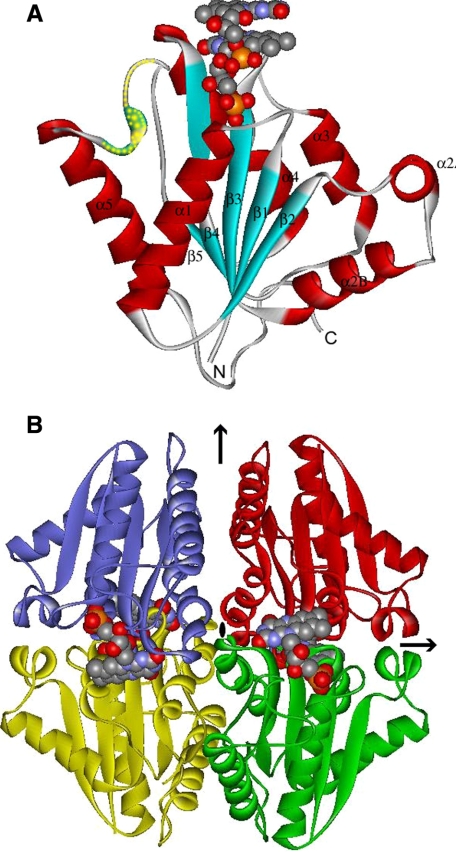
FIGURE 2.
Crystal structure of EmoB. A, structural element distribution of the monomeric form. Secondary structure elements have been numbered sequentially as α1-α5 and β1-β5 following the convention. N and C refer to N- and C-terminal regions, respectively. The disordered area (and the area of high temperature factors) is indicated by yellow dots. The FMN molecules are represented by the Corey-Pauling-Koltun model. B, arrangements of tetrameric EmoB in D2 symmetry. The black arrows and central oval indicate the location of the crystallographic 2-fold axis. The relative packing orientation observed in the pair of the yellow and green molecules (or blue and red) is typical among many dimeric NAD(P)H:flavin oxidoreductases. The figures were made using WebLab ViewerLite 3.20 (Accelrys Inc.).

