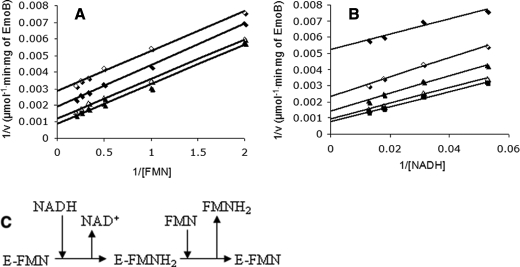
FIGURE 6.
Double-reciprocal plots of initial velocities of EmoB versus substrate concentrations. A, enzyme activity was assayed with constant concentrations of NADH: 19 μm (⋄), 32 μm (♦), 56 μm Δ, and 78 μm (▴). B, enzyme activity was assayed with constant concentrations of FMN: 0.5 μm (♦), 1 μm (⋄), 2 μm ▴, 3 μm Δ, and 4 μm (▪). C, shown is the deduced ping-pong reaction mechanism of EmoB from kinetic analysis.

