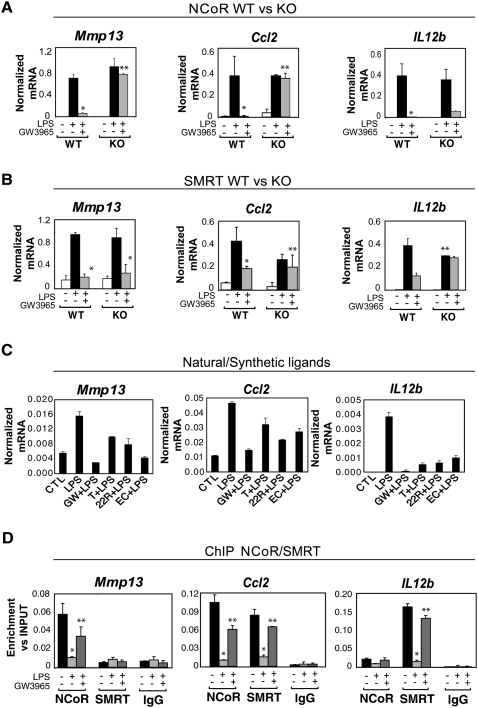
Figure 2.
Expression profiles and promoter occupancy of NCoR- and SMRT-dependent target genes. (A,B) Expression profiles of NCoR-specific (Mmp13), SMRT-specific (Il12b), and NCoR/SMRT-dependent genes (Ccl2) analyzed by Q-PCR in wild-type, NCoR−/−, or SMRT−/− macrophages. Cells were treated with DMSO (white bars) or with LPS (1 μg/mL) for 6 h in the absence (black bars) or presence of LXR ligand (GW3965, 1 μM, gray bars) in wild-type versus NCoR−/− (A) or wild-type versus SMRT−/− macrophages (B). (*) P < 0.05 versus LPS; (**) P < 0.05 versus GW3965 + LPS wild type. (C) Effects of natural and synthetic LXR ligands (1 μM GW3965, 1 μM T1317, 5 μM 22R hydroxycholesterol, and 5 μM 24,25 epoxycholesterol) on LPS responses. (D) Promoter occupancy of the target genes described in A and B as evaluated by ChIP analysis. Primary macrophages were untreated (black bars) or treated with LPS (1 μg/mL) or GW3965 + LPS as indicated for 1 h. ChIP assays were performed with an antibody against NCoR or SMRT or control IgG. Immunoprecipitated DNA was analyzed by real-time PCR using primers specific for the indicated promoters. (*) P < 0.01 versus control; (**) P < 0.05 versus LPS. Results are expressed as the average of three independent experiments. Error bars represent standard deviations.

