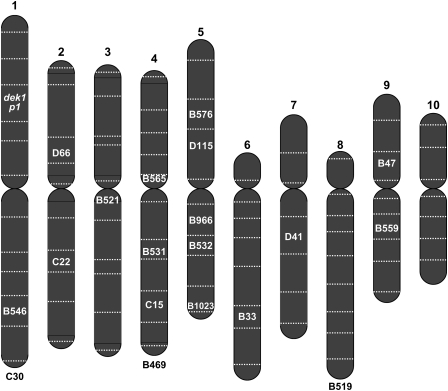
Figure 5.
Distribution of chromosomal rearrangement breakpoints. Schematic diagram of maize chromosomes 1–10 (left to right) divided into genetic bins by horizontal lines. In each rearrangement, one breakpoint is in bin 1.03, at the site of Ac/fAc insertions in or near the p1 and dek1 genes (italics); chromosome bin positions of the other breakpoint in each rearrangement allele are shown. Notations below chromosomes indicate those rearrangements that map to particular chromosomes, but whose position within the chromosome is unknown. Evidence supporting the map positions shown here is summarized in Table 1.

