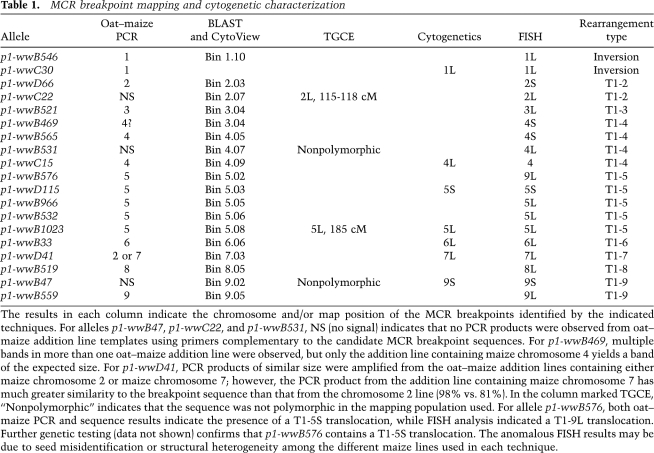
Table 1.
MCR breakpoint mapping and cytogenetic characterization
The results in each column indicate the chromosome and/or map position of the MCR breakpoints identified by the indicated techniques. For alleles p1-wwB47, p1-wwC22, and p1-wwB531, NS (no signal) indicates that no PCR products were observed from oat–maize addition line templates using primers complementary to the candidate MCR breakpoint sequences. For p1-wwB469, multiple bands in more than one oat–maize addition line were observed, but only the addition line containing maize chromosome 4 yields a band of the expected size. For p1-wwD41, PCR products of similar size were amplified from the oat–maize addition lines containing either maize chromosome 2 or maize chromosome 7; however, the PCR product from the addition line containing maize chromosome 7 has much greater similarity to the breakpoint sequence than that from the chromosome 2 line (98% vs. 81%). In the column marked TGCE, “Nonpolymorphic” indicates that the sequence was not polymorphic in the mapping population used. For allele p1-wwB576, both oat–maize PCR and sequence results indicate the presence of a T1-5S translocation, while FISH analysis indicated a T1-9L translocation. Further genetic testing (data not shown) confirms that p1-wwB576 contains a T1-5S translocation. The anomalous FISH results may be due to seed misidentification or structural heterogeneity among the different maize lines used in each technique.

