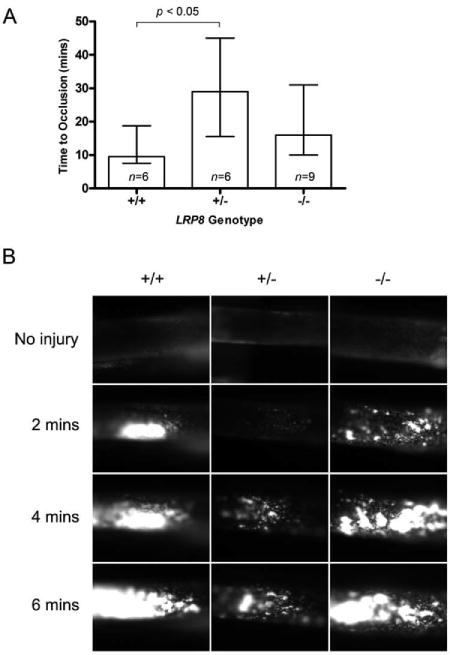
Figure 3. Thrombus formation assessed by intravital microscopy is altered in vivo.

Platelets were labeled with Rhodamine 6G, and thrombosis was initiated with 12.5% FeCl3 applied to the carotid artery. Time to cessation of flow is plotted as median ± Q1-Q3 (A). Representative images of thrombus formation are shown (B).
