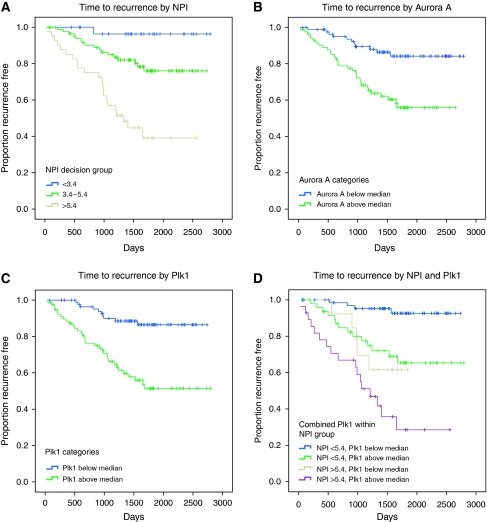
Figure 2.
Kaplan–Meier curves showing association between NPI, Plk1 and Aurora A and disease-free survival (days from diagnosis to death, recurrence or last follow-up) across the whole series. (A) NPI and disease-free survival segregated into the three decision group categories, P<0.001. (B) Aurora A and disease-free survival stratified by those patients lying above or below the median LI; HR=3.31 (1.67–6.57), P<0.001. (C) Plk1 and disease-free survival stratified by those patients lying above or below the median LI; HR=4.48 (2.21–9.09), P<0.001. (D) Effect of Plk1 after adjustment for NPI; HR=3.31 (1.57–6.97) risk above Plk1 median relative to below median, P=0.002.

