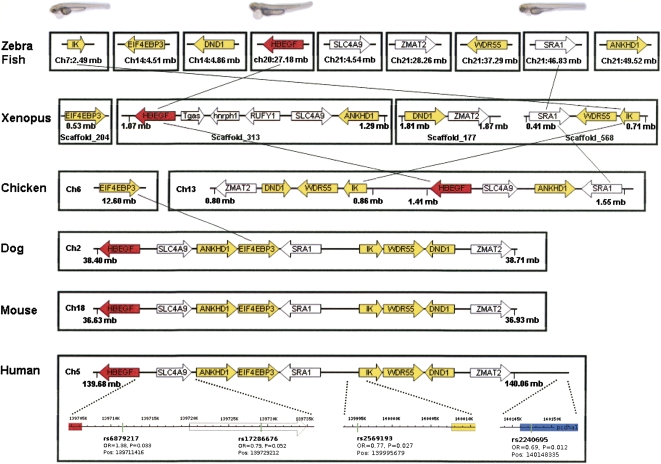
Figure 4.
Organization of the CM-cluster genes during vertebrate evolution. CM-cluster orthologs were mapped to their chromosomal positions using ENSEMBL and BLAST analysis. Gene size and chromosome length were not drawn to scale. Colored genes were analyzed for expression coregulation; genes illustrated in the same color were found to be coordinately expressed (Supplemental Table 6). Heart failure phenotypes in zebrafish are shown on the top, and SNPs associated with human cardiomyopathy at the bottom.

