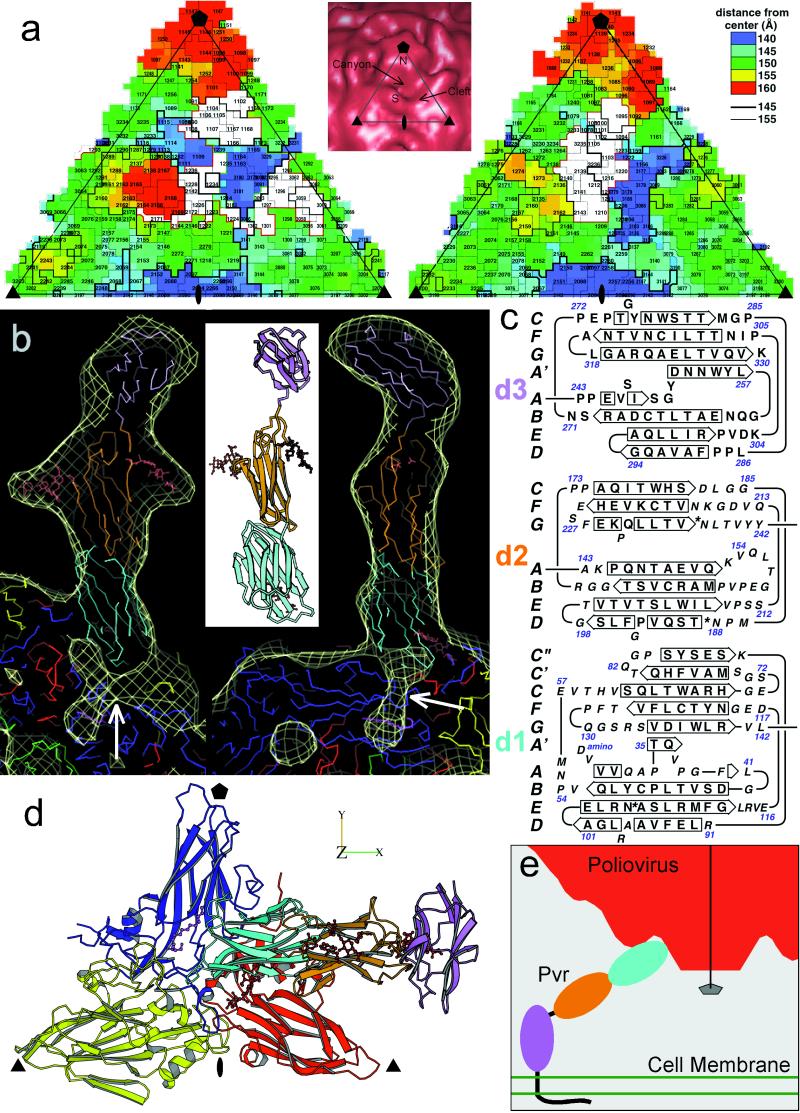
Figure 3.
(a) “Road map” representations (36, 37) of poliovirus (Left) and rhinovirus-14 [Right; (33)]. The corresponding triangular area of the capsid surface, bounded by a 5-fold and two 3-fold icosahedral symmetry axes, is marked (Inset). The radial distances of surface residues from the virion center are color coded and contoured [see key (Top Right)]. Nomenclature: 3145, residue 145 of VP3. The receptor footprints are shown in white. (b) A ribbon diagram (38) of the sPvr model is flanked by two views (39) of a single sPvr molecule as portrayed in the cryoelectron microscopy density map (white cage), enclosing the model of the three sPvr domains, d1 (cyan), d2 (orange), and d3 (violet). Carbohydrates attached to d2 [to N188 (Left) and N237 (Right)] and possibly to d1 are shown in brown. Also shown are the capsid proteins VP1 (blue), VP2 (yellow), VP3 (red), and VP4 (green). The tunnel beneath the sPvr-binding site is evident (white arrows). “Pocket factor” is magenta. (c) The sPvr sequence is mapped onto secondary structural elements of the homology model. Asn residues thought to be glycosylated are marked with asterisks. (d) Ribbon diagram (38) showing the docking of the sPvr model onto the capsid surface. Same color conventions as in b. The axes allow this view to be related to Fig. 4. (e) Schematic diagram showing a possible binding configuration of poliovirus with intact membrane-bound Pvr.

