Abstract
A new rotation invariant texture analysis technique using Radon and wavelet transforms is proposed. This technique utilizes the Radon transform to convert the rotation to translation and then applies a translation invariant wavelet transform to the result to extract texture features. A k-nearest neighbors (k-NN) classifier is employed to classify texture patterns. A method to find the optimal number of projections for the Radon transform is proposed. It is shown that the extracted features generate an efficient orthogonal feature space. It is also shown that the proposed features extract both of the local and directional information of the texture patterns. The proposed method is robust to additive white noise as a result of summing pixel values to generate projections in the Radon transform step. To test and evaluate the method, we employed several sets of textures along with different wavelet bases. Experimental results show the superiority of the proposed method and its robustness to additive white noise in comparison with some recent texture analysis methods.
Keywords: Radon transform, rotation invariance, texture analysis, wavelet transform
I. Introduction
Texture analysis is an important issue in image processing with many applications including medical imaging, remote sensing, content-based image retrieval, and document segmentation. Over the last three decades, texture analysis has been widely studied and many texture classification techniques have been proposed in the literature. Ideally texture analysis should be invariant to translation and rotation. However, most of the proposed techniques assume that texture has the same orientation, which is not always the case.
Recently, rotation invariant approaches have been the focus of interest, and different groups have proposed various rotation invariant texture analysis methods [1]. Davis [2] uses polarogram, which is a statistical function, defined on the co-occurrence matrix with a fixed displacement vector and variable orientation. Pietikainen, et al. [3] present a collection of features based on center-symmetric auto-correlation, local binary pattern, and gray-level difference to describe the texture, most of which locally invariant to rotation. Ojala, et al. [4] use binary patterns defined for circularly symmetric neighborhood sets to describe the texture. Kashyap and Khotanzad [5] have developed a circular symmetric autoregressive random field (CSAR) model to solve the problem. In this method, for each pixel, the neighborhood points are defined on only one circle around the pixel. Mao and Jain [6] present rotation invariant SAR (RISAR) model based on CSAR model, in which the neighborhood points of a pixel are defined on several circles around it. In all of these methods, a neighborhood is utilized, which captures only the local variation information of the texture and overlooks the global information of texture.
Markov random field (MRF) has been used by researchers for texture analysis. Cohen, et al. [7] model texture as Gaussian Markov random field and use the maximum likelihood technique to estimate the coefficients and rotation angles. The problem of this method is that the likelihood function is highly nonlinear and local maxima may exist. Chen and Kundu [8] use multichannel subband decomposition and a hidden Markov model (HMM) to solve the problem. They use a quadrature mirror filter to decompose the image into subbands and model the features of subbands by an HMM. In their method, textures with different orientations are assumed to be in the same class. Since textures with different orientations create different signal components for each subband, this increases the variations in the feature space. Hence, as the number of classes increases, the performance may deteriorate.
Circular-Mellin features [9] are created by decomposing the image into a combination of harmonic components in its polar form and are shown to be rotation and scale invariant. Zernike moments [10] are used to create rotation, scale and illumination invariant color texture characterization. Greenspan, et al. [11] use the steerable pyramid model to get rotation invariance. They extract features from the outputs of oriented filters and define a curve fc (θ) across the orientation space. Since the rotation of the image corresponds to the translation of fc (θ) across θ, DFT magnitude of fc (θ) (which is translation invariant) provides rotation invariant features.
Recently, multiresolution approaches such as Gabor filters, wavelet transforms, and wavelet frames have been widely studied and used for texture characterization. Wavelets provide spatial/frequency information of textures, which are useful for classification and segmentation. However, wavelet transform is not translation and rotation invariant. Several attempts have been made to use the wavelet transform for rotation invariant texture analysis. The proposed methods may use a preprocessing step to make the analysis invariant to rotation or use rotated wavelets and exploit the steerability to calculate the wavelet transform for different orientations to achieve invariant features. Pun and Lee [12] use log-polar wavelet energy signatures to achieve rotation and scale invariant features. Logarithm is employed to convert the scale variations to translation variations. However, this deteriorates the frequency components of the signal. Furthermore, the trend of intensity changes of the image in the polar form changes as r changes (as we move away from the origin, intensities change more quickly as θ changes). This is not desirable as we use the frequency components for classification. Manthalkar, et al. [13] combine the LH and HL channels of the wavelet decomposition to get rotation invariant features, at the cost of losing the directional information of the texture. Charalampidis and Kasparis [14] use wavelet-based roughness features and steerability to obtain rotation invariant texture features. The introduced feature vector consists of two subvectors and . The subvector does not hold the directional information and is obtained by combining the produced weighted roughness features at different orientations. The second subvector contains features with directional information that are computed as the maximum absolute feature differences for directions that differ by 45°. Therefore in both of these feature subvectors, the angular variations are ignored. This method has complex computations.
Haley and Manjunath [15] employ a complete space-frequency model using Gabor wavelets to achieve a rotation-invariant texture classification. This method is also computationally complex. Wu and Wei [16] create 1-D signals by sampling the images along a spiral path and use a quadrature mirror filter bank to decompose the signals into subbands and calculate several features for each subband. In this method, uniform fluctuations along the radial direction do not correspond to the uniform fluctuations in the 1-D signal, due to the increasing radius of the spiral path. Therefore the variational information in the radial direction is deteriorated. Do and Vetterli [17] use a steerable wavelet-domain hidden Markov model (WD-HMM) and a maximum likelihood (ML) estimator to find the model parameters. However, the rotation invariant property of the estimated model relies on the assumption that the ML solution of the WD-HMM is unique and the training algorithm is able to find it. They examine the rotation invariance property of their method for a few texture images (13 from Brodatz album).
Radon transform has been widely used in image analysis. Magli et al. [18] use Radon transform and 1-D continuous wavelet transform to detect linear patterns in the aerial images. Warrick and Delaney [19] use a localized Radon transform with a wavelet filter to accentuate the linear and chirp-like features in SAR images. Leavers [20] uses the Radon transform to generate a taxonomy of shape for the characterization of abrasive powder particles. Do and Vetterli [21] use ridgelet transform, which is a combination of finite Radon transform and 1-D discrete wavelet transform to approximate and denoise the images with straight edges. Ridgelet transform is also used to implement curvelet decomposition, which is used for image denoising [22].
Due to the inherent properties of Radon transform, it is a useful tool to capture the directional information of the images. This paper presents a new technique for rotation invariant texture classification using Radon and wavelet transforms. The proposed technique utilizes the Radon transform to convert the rotation to translation and then applies a translation invariant wavelet transform to the result to extract texture features. A k-nearest neighbors (k-NN) classifier is employed to classify each texture to an appropriate class. A method to find the optimal number of projections for the Radon transform is developed.
Although the polar concept has been previously used in the literature to achieve rotation invariance, the proposed method has differences with the previous methods. Instead of using the polar coordinate system, the method uses the projections of the image in different orientations. In each projection, the variations of the pixel intensities are preserved even if the pixels are far from the origin1. Therefore, the method does not measure the intensity variations based on the location in the image. Furthermore, despite some existing approaches, the proposed method captures global information about the texture orientation. Therefore, it preserves the directional information. It is also shown that this technique is very robust to additive white noise. The outline of the paper is as follows: In Section II, we briefly review Radon and wavelet transforms and their properties. In Section III, we present our rotation invariant texture classification approach. Experimental results are described in Section IV and conclusions are presented in Section V.
II. Basic Material
Radon and wavelet transforms are the fundamental tools used in the proposed approach. In this section we briefly review these transforms and their properties in order to establish the properties of the proposed technique.
A. Radon Transform
The Radon transform of a 2-D function f (x, y) is defined as:
| (1) |
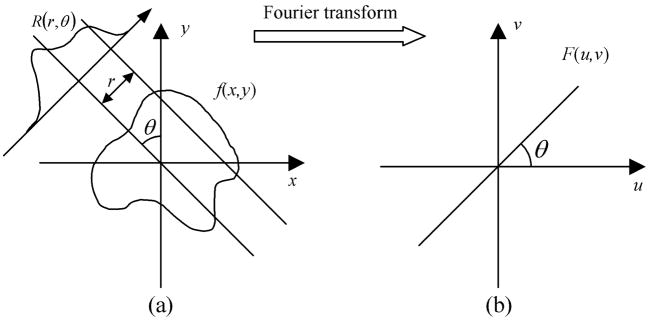
where r is the perpendicular distance of a line from the origin and θ is the angle formed by the distance vector. According to the Fourier slice theorem, this transformation is invertible. Fourier slice theorem states that for a 2-D function f (x, y), the 1-D Fourier transforms of the Radon transform along r, are the 1-D radial samples of the 2-D Fourier transform of f (x, y) at the corresponding angles [23]. This theorem is depicted in Fig. 1, where it is shown that 1-D Fourier transforms of Radon transform in Fig. 1(a) correspond to 1-D samples of the 2-D Fourier transform of f (x, y) in Fig. 1(b).
Fig. 1.
(a) Radon transform of the image. (b) 1-D Fourier transforms of the projections, which make the 2-D Fourier transform of the image.
B. Wavelet Transform
Wavelet transform provides a time-frequency representation of a signal. Wavelet coefficients of a signal f (t) are the projections of the signal onto the multiresolution subspaces and , j ∈ Z where the basis functions ϕj,k (t) and ψj,k (t) are constructed by dyadic dilations and translations of the scaling and wavelet functions ϕ(t) and ψ(t):
| (2) |
| (3) |
The scaling and wavelet functions satisfy the dilation and wavelet equations:
| (4) |
| (5) |
where n ∈ Z. For the orthogonal wavelet bases, the wavelet function satisfies the following equation [24]:
| (6) |
For any function f (t) ∈ L2 (ℛ) we have:
| (7) |
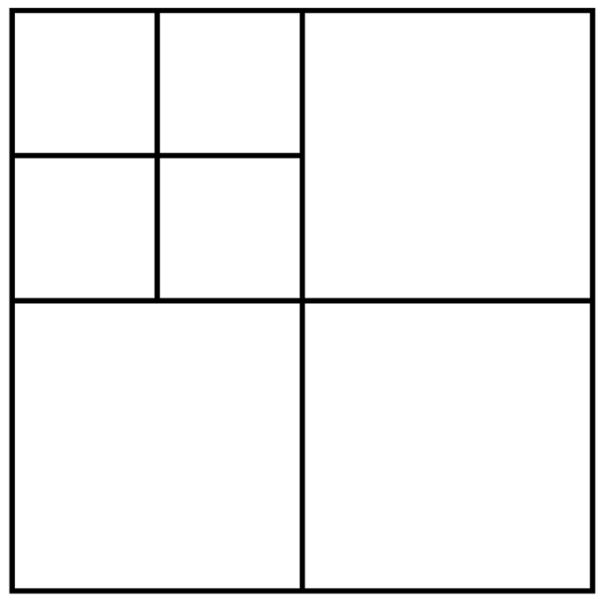
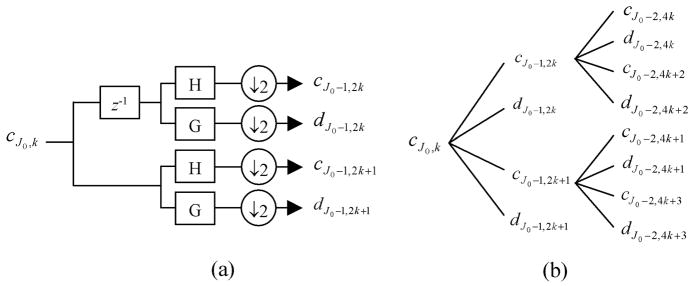
Using the coefficients cj,k at a specific level j we can calculate the coefficients at level j-1 using a filter bank as shown in Fig. 2. In this figure, two levels of decomposition are depicted. H and G are lowpass and highpass filters corresponding to the coefficients h(n) and g(n) respectively. The wavelet decomposition of a 2-D signal can be achieved by applying the 1-D wavelet decomposition along the rows and columns of the image separately. This is equivalent to projecting the image onto separable 2-D basis functions obtained from the products of 1-D basis functions [24]. Fig. 3 shows the frequency subbands resulted from two levels of decomposition of an image.
Fig. 2.

The filter bank used to calculate the wavelet coefficients.
Fig. 3.
Frequency subbands produced by two levels of decomposition of an image.
III. Proposed Method
In this section, the rotation invariant texture analysis technique using Radon and wavelet transforms is introduced and some useful properties of this method are shown. Optimal number of projections for the Radon transform, and the robustness of the method to additive white noise are discussed.
A. Rotation Invariance Using Radon Transform
To develop a rotation invariant texture analysis method, a set of features invariant to rotation is needed. Wavelet transform has been used as a powerful tool for texture classification. However, it is not invariant to rotation. It seems that if we could calculate the wavelet transform in different orientations, we would achieve a rotation invariant texture analysis method. But for a large number of orientations (e.g., 180), this is impractical due to the high computational complexity and large number of produced features. Some researchers have used steerability concept to calculate the outputs of rotated filters efficiently [11],[14].
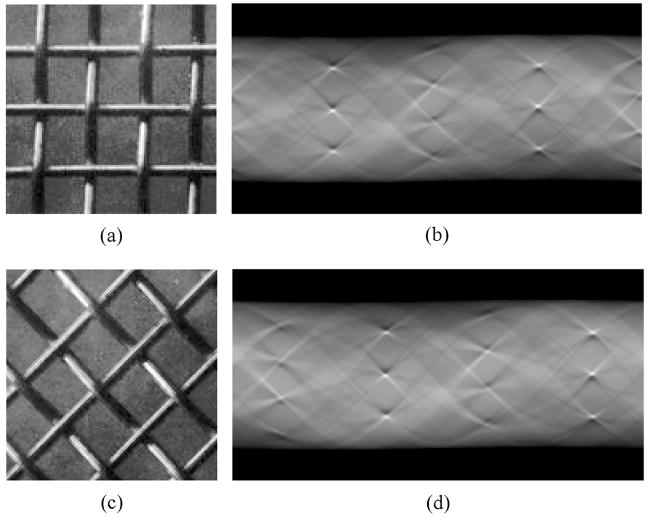
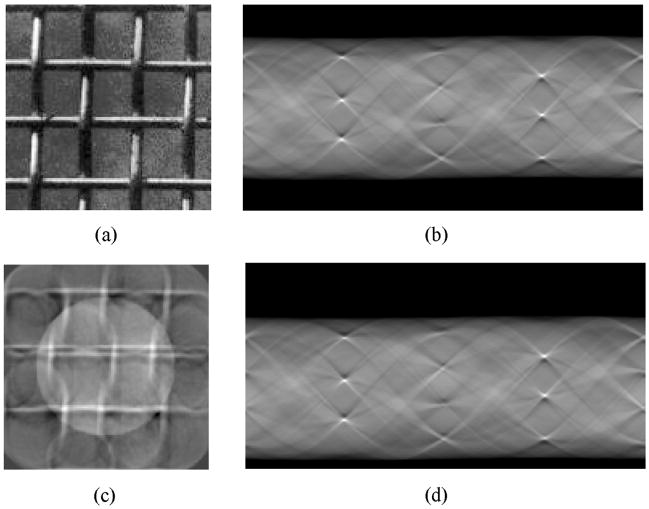
To reduce the number of features and at the same time to evaluate the image at different orientations, we propose a new technique using Radon and wavelet transforms. This technique is depicted in Fig. 4. As shown in this figure, we first calculate the Radon transform of the image and then use a translation invariant wavelet transform to calculate the frequency components and extract the corresponding features. Since the Radon transform is invertible, we do not lose any texture information. Rotation of the input image corresponds to the translation of the Radon transform along θ, which is more tractable. To maintain the uniformity of the Radon transform for different orientations, we calculate the Radon transform for a disk area of the texture image. Fig. 5 shows how the Radon transform changes as the image rotates. As shown, the rotation of the texture sample corresponds to a circular shift along θ (horizontal axis in this figure). Therefore, using a translation invariant wavelet transform along θ, we can produce rotation invariant features.
Fig. 4.
Block diagram of the proposed technique.
Fig. 5.
(a) Texture image sample, (b) its Radon transform, (c) rotated texture sample, (d) its Radon transform. As shown here, the rotation effect is a translation along θ (horizontal axis here).
As we will show next, this technique preserves the orthogonality of the basis functions of the wavelet transform. This makes the extracted features uncorrelated, and allows classification using fewer number of features.
B. Properties of the Proposed Method
As we mentioned earlier, 2-D wavelet transform of an image is equal to the projections of the image onto the 2-D basis functions. If we refer to the Radon transform of the image by R(r,θ), the wavelet transform coefficients by c(·,·), and the corresponding 2-D orthogonal wavelet basis functions by ϕ (x, y) then:
| (8) |
By defining , we have:
| (9) |
This shows that g(x, y) plays as a basis function in the xy plane (image domain).
Following are some properties of function g(x, y) provided that the wavelet is orthogonal and ϕ (x, y) is separable, i.e., ϕ (x, y) = ϕ1(x)ϕ2(y). Note that either ϕ1(x) or ϕ2(y) is wavelet function, and the other is either wavelet or scaling function, which their product construct a separable orthonormal wavelet basis of L2 (ℛ2) [24].
1) if ϕ1(x) is a wavelet function.
Proof
| (10) |
By replacing s = x cos θ + y sin θ and t = y for the inner integral:
| (11) |
Since ϕ1(s) is a wavelet function, according to (6) the inner integral is zero. Therefore, the whole integral is equal to zero. This property makes the extracted features from the corresponding subbands invariant to the mean of the intensities (image brightness or uniform illumination).
2) As , g(x, y) → 0.
Proof
The functions ϕ1(x) and ϕ2(x) are bounded and support-limited. Let’s denote the nonzero interval of ϕ1(x) by [a,b]. Writing in the polar form as x = r cos α and y = r sin α, we have
| (12) |
As r → ∞, the lower and upper bounds of the above integral both approach α + π/2. Therefore since ϕ1(θ)and ϕ2 (θ)are bounded, the integral approaches zero, i.e., g(x, y) → 0 as r → ∞. This property shows that the functions g(x, y)’s capture the local variations of the image, hence making a useful tool for multiresolution analysis.
3) The functions g(x, y)’s are orthogonal.
Proof
If i ≠ j:
| (13) |
Since ϕ(x, y) is separable, i.e. ϕi (x, y) = ϕi1(x) ϕi2(y), we have:
| (14) |
Now by replacing s = x cos θ + y sin θ and t = x cos θ′ + y sin θ′, and using the chain rule, we have Jacobian:
Thus dsdt = sin(θ′ − θ)dxdy and
| (15) |
If or , then the integrant is zero for θ ≠ θ′. According to (6) this condition holds because either ϕi1(s) or ϕj1(s) or both are wavelet functions. Therefore, we need to calculate the integral (14) over the lineθ = θ′:
| (16) |
By choosing s = x cosθ + y sinθ, t = −x sin θ + y cos θ and using Jacobian, we have:
Thus dsdt = dxdy and
| (17) |
Since i ≠ j, and we have orthogonal wavelet bases, ϕi1(s) and ϕj1(s) are orthogonal, hence and the integrant becomes zero. Therefore 〈gi, gj〉 = 0 for i ≠ j. If i = j then the inner integral becomes ∞. Thus 〈gi, gi〉 = ∞. Consequently
| (18) |
Therefore, gi (x, y) and gj (x, y) are orthogonal. Note that the property of 〈gi, gi 〉 = ∞ relates to the fact that in general the Radon transform is defined for an image with unlimited support. In practice, the image support is confined to [−L, L]×[−L, L] and the integrals of squares of the functions g(x, y)’s will be limited. In other words,
| (19) |
According to the property (3) the outputs of the wavelet transform in Fig. 4 are uncorrelated, so the extracted features are uncorrelated. This allows separation of the classes using a fewer number of features.
In order to depict samples of the function g(x, y) easily, we rewrite its formula in the polar form. According to the definition, we have:
| (20) |
Using the polar coordinate system and replacing x = r cos α and y = r sin α we have:
| (21) |
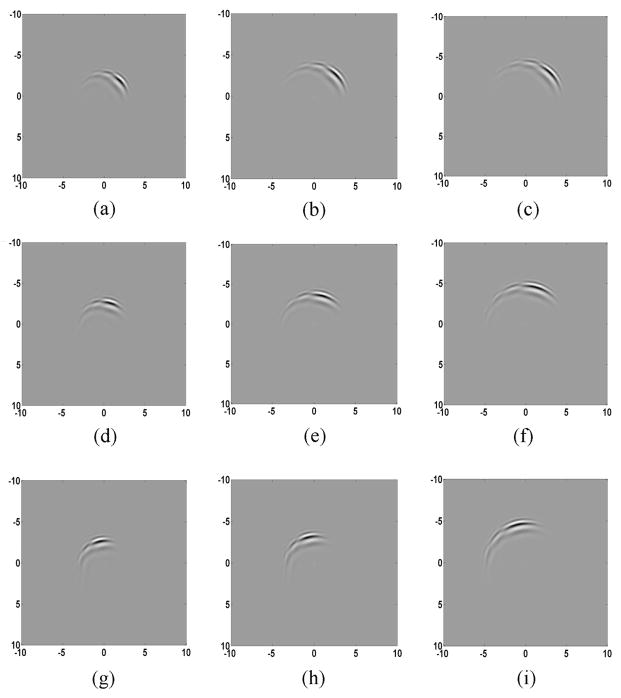
If we suppose ϕ2(α)is defined over [0, π] then g(r,α) = ϕ1(r cos α)* ϕ2(α), which is simpler for calculation. Fig. 6 shows some samples of g(x, y)’s using Daubechies wavelet of length 6 (db6). These functions are displayed based on the following formula for the scale j=1 and different k1’s and k2’s:
| (22) |
where ϕj,k2(α) is defined over [0,π] (zero elsewhere). As shown, by increasing k1 from 0 to 4 in Fig.’s 6(a)–(c), the peaks of the functions, radially move away from the origin, but the orientations do not change. However, by increasing k2 form 0 to 2 in Fig. 6, the functions rotate around the origin. This shows how the proposed method locally extracts the frequency components of the image with preserving rotation invariance.
Fig. 6.
Some samples of g(x,y) at scale j=1, using db6 wavelet and scaling functions, with different k1 and k2 values. (a) k1=0, k2=0, (b) k1=2, k2=0, (c) k1=4, k2=0, (d) k1=0, k2=1, (e) k1=2, k2=1, (f) k1=4, k2=1 (g) k1=0, k2=2, (h) k1=2, k2=2, (i) k1=4, k2=2.
C. Translation Invariant Wavelet
Recently several approaches have been proposed to get translation invariant wavelet transform. These transforms are invariant to circular shift of the signal. As mentioned before, the rotation of the input image corresponds to the translation of its Radon transform along θ. Although a translation invariant wavelet transform seems to be useful for this application, its application in both directions (r and θ) leads to suboptimal results compared with non-translation invariant wavelet transform. This is because although the circular shift along θ corresponds to the rotation of the image, the circular shift along r does not correspond to a regular geometric distortion. This issue is depicted in Fig. 7, which shows that the shifted Radon transform along r, corresponds to an image significantly different from the original image. As shown in this figure, the two textures are considerably different and should not be classified to the same class. To overcome this problem, we apply a 1-D translation invariant wavelet transform along θ and a 1-D ordinary wavelet transform along r.
Fig. 7.
The effect of circular shift of the Radon transform along r. As shown here this circular shift destroys the texture. (a) Texture image, (b) its Radon transform for the circular area, (c) inverse Radon transform of (d), (d) shifted Radon transform along r.
In this paper, we use the algorithm proposed by Pesquet et al. [25] to get a translation invariant wavelet transform. The algorithm is shown in Fig. 8. The translation variance in discrete wavelet transform is due to the required decimation operation (i.e., the down-sampling by two in Fig. 2). As shown in Fig. 8(a), in this algorithm this problem is overcome by applying additional discrete wavelet decomposition after shifting the sequence by one sample. This algorithm is recursively applied on the output sequences of the lowpass filters as shown in Fig. 8(b). This figure shows how the coefficients produced in each level of decomposition are given appropriate indices. In this way, circular shifts of the input will correspond to circular shifts of the coefficients. The resulting coefficients are redundant, in the sense that, J levels of decomposition of a signal f(t) with N samples generates J·N wavelet and N scaling coefficients.
Fig. 8.
(a) One level of translation invariant wavelet decomposition. (b) The coefficients produced by two levels of translation invariant wavelet decomposition.
D. Optimal Number of Projections
One of the important issues in using the Radon transform for creating texture features is finding the optimal number of projections to get the minimum classification error. By changing the number of projections, we scale (compress or expand) the Radon transform along θ. This scales the Fourier transform of the signal along θ and affects the extracted texture features. It is desirable to find the optimal number of projections that leads to most discriminative features with reasonable calculations. In order to achieve this goal, we can make the sampling rate along θ consistent (proportional) with the sampling rate along r. The sampling rate along r in the Radon transform reflects the sampling rate of the signal along r in the polar coordinate system. But this is not the case for the sampling rate along θ. For the moment, suppose we have just changed the coordinate system from Cartesian to polar and we are looking for an appropriate sampling rate for the new coordinate system. As we move away from the origin, displacements increase for a constant change in the orientation. Specifically, for an increment of Δθ along θ, a point with a distance of r form the origin has r·Δθ displacement. Therefore, for all the points inside a circle with radius R, the average displacement for a constant increment of Δθ along θ is:
| (23) |
To make the sampling rate consistent in the r and θ directions, we can scale the Radon transform along θ by a factor of R/2. In this case, if the number of samples for r values from 0 to R is N, then , hence Δθ = 2/N and the number of samples along θ will be 2π/Δθ = πN. This is a good approximation of the sampling rate if we just change from Cartesian to polar coordinate system. But in this paper, we use Radon transform, which calculates the projection of the signal in different orientations. Indeed, the line integrals of the image during the calculation of the Radon transform act like a lowpass filter. This means that the low frequency components are amplified. So we may need a higher sampling rate to reach to the optimal point where weak high frequencies are sampled appropriately. However, the number of samples should not exceed 2πN, because in that case each increment in orientation corresponds with a movement of one pixel size in the boundary of the image (circle), which is R/N. Therefore, the maximum number of samples is 2πR/(R/N)=2πN. In addition, the optimal number of projections depends on the frequency distribution of the texture images. Therefore, a number of projections between πN and 2πN may create the optimal classification result. One method to find the optimal number of projections is to try different numbers and pick the best one.
E. Noise Robustness
One of the advantages of the proposed approach is its robustness to additive noise. Suppose the image is denoted by f̂(x, y) = f (x, y)+η(x, y) where η(x, y) is white noise with zero mean and variance σ2. Then
| (24) |
Since the Radon transform is line integrals of the image, for the continuous case, the Radon transform of noise is constant for all of the points and directions and is equal to the mean value of the noise, which is assumed to be zero. Therefore,
| (25) |
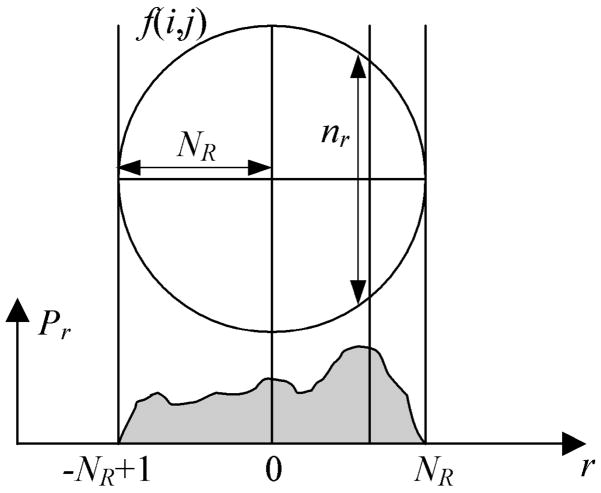
This means zero-mean white noise has no effect on the Radon transform of the image. In practice, the image is composed of a finite number of pixels. Assume we add up intensity values of the pixels to calculate the Radon transform as shown in Fig. 9. Suppose f (i, j) is a 2-D discrete signal whose intensity values are random variables with mean μ and variance σ2. For each point of the projection pr, we add up nr pixels of f(i, j). Therefore, var (pr) = nr · σ2 and mean(pr)=nr · μ. On the other hand, , where NR is the radius of the circular area in terms of pixels, and the integer r is the projection index, which varies from −NR +1 to NR. The average of is:
| (26) |
Fig. 9.
The diagram for calculations in the Radon domain.
Suppose E{} denotes the expected value, and define . Then
| (27) |
For large NR, Ep is approximately equal to:
| (28) |
where R is the radius of the circular area. Therefore,
| (29) |
For the signal, and for white noise with zero mean and variance . Thus,
| (30) |
| (31) |
Therefore, . In practice 16NR/3π≫1, thus
| (32) |
Hence SNR is increased by 1.7NR , which in practice is a large quantity. Alternatively, considering the fact that in many practical situations , we may write
| (33) |
Therefore, SNRprojection ≈ SNRimage + 1.7NRSNRimage. Since 1.7NR ≫ 1, SNRprojection ≈ 1.7NRSNRimage. This shows that SNR has been increased by a factor of 1.7NR, which is practically a large quantity, e.g., 1.7×64≅109. As a result, this method is very robust to additive noise.
F. Feature Set
For each subband in Fig. 3, we calculate the following features:
| (34) |
| (35) |
where and M and N are the dimensions of each submatrix. The introduced features in (34) and (35) are different from the traditional energy and entropy features in the sense that instead of using the squared values, we use the square root of the absolute values of I (x, y). This applies a scaling to the subband elements and provides more discriminant features. Note that the discrete Radon transform has higher rage of values compared with the intensity values of the image. The features e1 and e2 are used to respectively measure the energy and uniformity of the coefficients. The energy and entropy features have been shown to be useful for texture analysis [8],[12]. To compare with other traditional features in the literature, we also calculate the correct classification percentages using the following features:
| (36) |
| (37) |
Here e3 and e4 are the traditional energy features used in the literature [8],[12],[13],[26],[27].
G. Classification
We use the k-nearest neighbors (k-NN) classifier with Euclidian distance to classify each image into an appropriate class. In this algorithm, the unknown sample is assigned to the class most commonly represented in the collection of its k nearest neighbors [28]. The k nearest neighbors are the k samples of the training set, which have minimum distances to the unknown sample in the feature space. Since different features have different range of possible values, the classification may be based primarily on the features with wider range of values. For this reason, before classification, we normalize each feature using the following formula:
| (38) |
where fi,j is the jth feature of the ith image, and μj and σj are the mean and variance of the feature j in the training set.
On the other hand, the features may not have the same level of significance for classification. Therefore, we need a feature selection technique to choose the best combination of features and consequently to improve the classification. In this paper, we apply weights to the normalized features. The weight for each feature is calculated as the correct classification rate in the training set (a number between 0 and 1) using only that feature and leaving-one-out technique [28]. This is because features with higher discrimination power deserve higher weights. The approach is similar to match filtering. Although this method may not provide an optimal weight vector but is sensible and straightforward to implement.
IV. Experimental Results
We demonstrate the efficiency of our approach using three different data sets. In all of the experiments, we use 128×128 images. Therefore, the circular region inside the image has the radius of N=64 pixels. As mentioned before, a suitable sampling rate is more than Nπ≈200 but less than 2Nπ≈400. To obtain the optimal sampling rate for each data set, we compare the performances of different numbers of projections and choose the best one.
Data set 1 consists of 25 texture images of size 512×512 from Brodatz album [29] used in [12]. Each texture image was divided into 16 nonoverlapping subimages of size 128×128 at 0° to create a training set of 400 (25×16) images. For the test set, each image was rotated at angles 10° to 160° with 10° increments. Four 128×128 nonoverlapping subimages were captured from each rotated image. The subimages were selected from regions such that subimages from different orientations have minimum overlap. In total, we created 1600 (25×4×16) samples for the testing set (20% for training and 80% for testing).
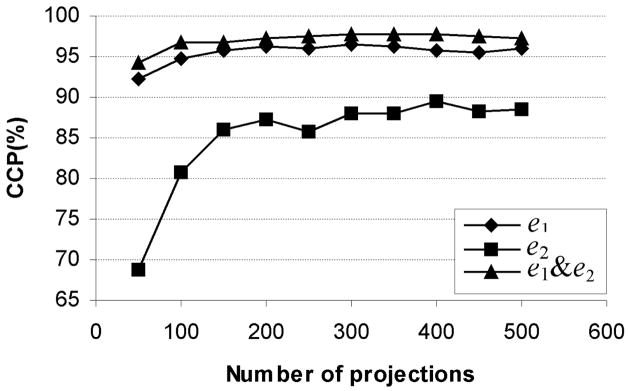
To evaluate the effect of choosing the optimal number of projections, we calculated the correct classification percentages (CCPs) using e1 and e2 features and their combination, produced by 5 levels of decomposition with db6 wavelet basis and different numbers of projections for angles between 0° and 360°. The three submatrices corresponding to the highest resolution were removed and not used for feature extraction. This is because for this data set, these submatrices correspond to the noise and are not valuable for classification. So the features were calculated from 13 submatrices. The results are presented in Fig. 10. The CCPs are the average of CCPs using k=1,3,5,7, and 9 for the k-NN classifier. As shown in this figure, if we stay in the range of πN and 2πN, the number of projections does not have a significant effect on CCPs for e1, but it creates some variation in CCPs for e2.
Fig. 10.
Correct classification percentages for different number of projections using e1, e2, and e1&e2 as features.
Although as shown in Fig. 10, the proposed method is not very sensitive to the number of projections in the proposed interval, for best performance one can optimize this number. In practice, this translates to the fine-tuning of the method to a practical application, which is commonly done for most image processing methods. We chose 288 projections for data set 1 and calculated the CCPs using four wavelet bases from Daubechies wavelet family with different filter lengths and 5 levels of decomposition. Table I shows the results using the introduced energy features (e1, e2, e3, e4 and a combination of e1 and e2 denoted by e1&e2), and different numbers of neighbors for the k-NN classifier.
TABLE I.
The correct classification percentages for data set 1 using different wavelet bases, feature sets, and k values for k-NN classifier
|
k |
|||||||||||
|---|---|---|---|---|---|---|---|---|---|---|---|
| Wavelet Bases | Features | 1 | 3 | 5 | 7 | 9 | 1 | 3 | 5 | 7 | 9 |
| Before Weight | After Weight | ||||||||||
| db2 | e1 | 96.1 | 96.4 | 96.3 | 95.9 | 95.7 | 96.4 | 97.1 | 96.6 | 96.1 | 96.1 |
| e2 | 68.7 | 69.3 | 70.9 | 72.4 | 72.4 | 85.5 | 85.9 | 87.0 | 86.7 | 86.9 | |
| e3 | 92.8 | 93.2 | 93.4 | 92.2 | 91.8 | 93.4 | 93.6 | 93.8 | 92.8 | 91.8 | |
| e4 | 94.8 | 95.8 | 95.7 | 94.2 | 94.4 | 95.1 | 96.1 | 95.9 | 94.9 | 94.6 | |
| e1&e2 | 92.2 | 93.3 | 92.8 | 94.2 | 93.6 | 96.7 | 97.6 | 97.9 | 97.4 | 97.6 | |
|
| |||||||||||
| db4 | e1 | 95.8 | 95.9 | 95.9 | 95.5 | 95.5 | 96.4 | 96.3 | 96.5 | 95.8 | 95.7 |
| e2 | 72.6 | 72.9 | 74.1 | 75.3 | 75.8 | 85.8 | 87.3 | 88.9 | 89.9 | 89.6 | |
| e3 | 92.5 | 93.0 | 93.5 | 93.4 | 92.8 | 92.8 | 93.8 | 93.9 | 93.0 | 92.5 | |
| e4 | 94.3 | 95.2 | 95.2 | 93.9 | 93.8 | 95.4 | 95.4 | 95.2 | 94.9 | 94.8 | |
| e1&e2 | 93.0 | 94.3 | 94.6 | 94.8 | 94.6 | 97.4 | 97.7 | 97.9 | 97.9 | 97.6 | |
|
| |||||||||||
| db6 | e1 | 95.5 | 96.2 | 96.1 | 95.7 | 95.6 | 95.6 | 96.4 | 95.9 | 95.9 | 95.8 |
| e2 | 71.2 | 70.9 | 71.6 | 73.9 | 73.6 | 86.9 | 88.1 | 89.4 | 89.9 | 90.3 | |
| e3 | 91.6 | 93.9 | 94.6 | 94.1 | 92.8 | 91.9 | 93.9 | 94.4 | 94.1 | 92.4 | |
| e4 | 94.4 | 95.5 | 95.3 | 94.8 | 94.0 | 93.6 | 95.4 | 94.9 | 94.6 | 94.3 | |
| e1&e2 | 92.3 | 94.7 | 94.6 | 95.3 | 95.0 | 96.4 | 97.7 | 97.6 | 97.8 | 97.9 | |
|
| |||||||||||
| db12 | e1 | 95.9 | 96.6 | 96.0 | 95.9 | 95.5 | 95.9 | 96.5 | 96.4 | 95.6 | 95.2 |
| e2 | 55.5 | 56.7 | 58.1 | 59.2 | 60.1 | 77.8 | 78.8 | 80.0 | 80.9 | 81.8 | |
| e3 | 91.9 | 93.7 | 93.1 | 92.7 | 92.3 | 92.6 | 93.8 | 93.3 | 92.6 | 92.8 | |
| e4 | 94.4 | 96.1 | 95.8 | 95.2 | 94.6 | 94.1 | 95.3 | 94.3 | 93.5 | 93.4 | |
| e1&e2 | 86.8 | 88.8 | 89.6 | 91.2 | 92.1 | 96.3 | 96.6 | 96.9 | 96.9 | 96.9 | |
As shown in Table I, changing the wavelet basis does not have a significant effect on the resulting CCPs for e1, e3 and e4, but for e2 there are some variations and in general e2 has significantly smaller CCPs compared with the other energy features. The energy feature e1 has a larger CCP compared with the other energy features. The CCPs do not notably change as k (the number of neighbors in k-NN classifier) increases. This shows that the clusters of different classes have considerable separation. We can also observe how the weights affect the CCPs. As shown, they significantly increase the CCPs using e2, but the CCPs using the other energy features increase only slightly. Before applying the weights, since e2 has a significantly smaller CCP compared with e1, its combination with e1 may decrease the CCP, but after applying the weights, it generally increases the CCP. The maximum CCP achieved is 97.9% with 26 features compared to the maximum of 93.8% in [12] using 64 features. Nevertheless, a direct comparison between the results of our proposed method and the method presented in [12] is not possible due to the difference between the classifiers. A Mahalanobis classifier is used in [12], with all the images at different orientations for both training and testing, while we used the images at 0° for training (20%) and all the other orientations for testing (80%). Data set 2 consists of 24 texture images used in [4]. These texture images are publicly available for experimental evaluation of texture analysis algorithms [30]. We used the 24-bit RGB texture images captured at 100 dpi spatial resolution and illuminant “inca” and converted them to gray-scale images. Each texture is captured at nine rotation angles (0°, 5°, 10°, 15°, 30°, 45°, 60°, 75°, and 90°). Each image is of size 538×716 pixels. Twenty nonoverlapping 128×128 texture samples were extracted from each image by centering a 4×5 sampling grid. We used the angle 0° for training and all the other angles for testing the classifier. Therefore, there are 480 (24×20) training and 3,840 (24×20×8) testing samples. The Radon transform was calculated at 256 projections between 0° and 360°. The wavelet transform was calculated using different wavelet bases and 5 levels of decomposition (16 submatrices). Table II shows the CCPs using four different wavelet bases and different number of neighbors for k-NN classifier. As shown in this table, the maximum CCP is 97.4% which is comparable with the maximum of 97.9% CCP in [4], although the weight vector used here is not guaranteed to be optimal. On the other hand, here the maximum of 97.4% CCP is obtained using only 32 features, while in [4] the employed texture feature for this data set is the corresponding histogram of the joint distribution of for (P,R) values of (8,1) and (24,3), which creates a total number of 10B1+26B2 features where B1 and B2 are the number of bins selected for VAR8,1 and VAR24,3, respectively. The numbers of bins B1 and B2 have not been mentioned for this data set, but it is obvious that the total number of 10B1+26B2 features is much greater than 32 features.
TABLE II.
The correct classification percentages for data set 2 using different wavelet bases, feature sets, and k values for k-NN classifier
|
k |
|||||||||||
|---|---|---|---|---|---|---|---|---|---|---|---|
| Wavelet Bases | Features | 1 | 3 | 5 | 7 | 9 | 1 | 3 | 5 | 7 | 9 |
| Before Weight | After Weight | ||||||||||
| db2 | e1 | 94.2 | 93.2 | 92.4 | 91.7 | 90.4 | 94.9 | 94.8 | 94.0 | 93.4 | 92.4 |
| e2 | 82.4 | 84.1 | 84.0 | 84.1 | 84.1 | 90.4 | 91.7 | 91.8 | 92.1 | 92.1 | |
| e1&e2 | 92.6 | 93.8 | 94.1 | 94.0 | 93.9 | 96.5 | 96.4 | 96.2 | 95.7 | 95.7 | |
|
| |||||||||||
| db4 | e1 | 93.3 | 92.8 | 91.9 | 91.9 | 91.2 | 95.6 | 94.7 | 94.7 | 94.1 | 92.8 |
| e2 | 82.1 | 83.7 | 85.2 | 85.5 | 86.0 | 93.0 | 94.3 | 94.1 | 94.3 | 94.3 | |
| e1&e2 | 94.3 | 94.9 | 94.9 | 95.1 | 95.4 | 97.1 | 97.3 | 97.2 | 96.8 | 96.3 | |
|
| |||||||||||
| db6 | e1 | 93.9 | 93.9 | 93.5 | 93.1 | 92.3 | 95.5 | 95.1 | 94.7 | 94.4 | 93.2 |
| e2 | 79.0 | 80.9 | 82.4 | 82.9 | 82.7 | 91.6 | 92.5 | 92.6 | 92.8 | 92.9 | |
| e1&e2 | 93.1 | 94.2 | 94.4 | 94.7 | 94.5 | 96.7 | 97.4 | 97.1 | 97.0 | 96.6 | |
|
| |||||||||||
| db12 | e1 | 94.6 | 94.0 | 93.8 | 93.6 | 93.0 | 95.6 | 95.5 | 95.1 | 94.9 | 93.8 |
| e2 | 68.8 | 71.5 | 72.8 | 74.5 | 75.5 | 85.4 | 87.6 | 88.3 | 88.8 | 89.3 | |
| e1&e2 | 89.6 | 91.5 | 91.5 | 91.9 | 91.8 | 96.4 | 96.8 | 97.2 | 96.7 | 96.1 | |
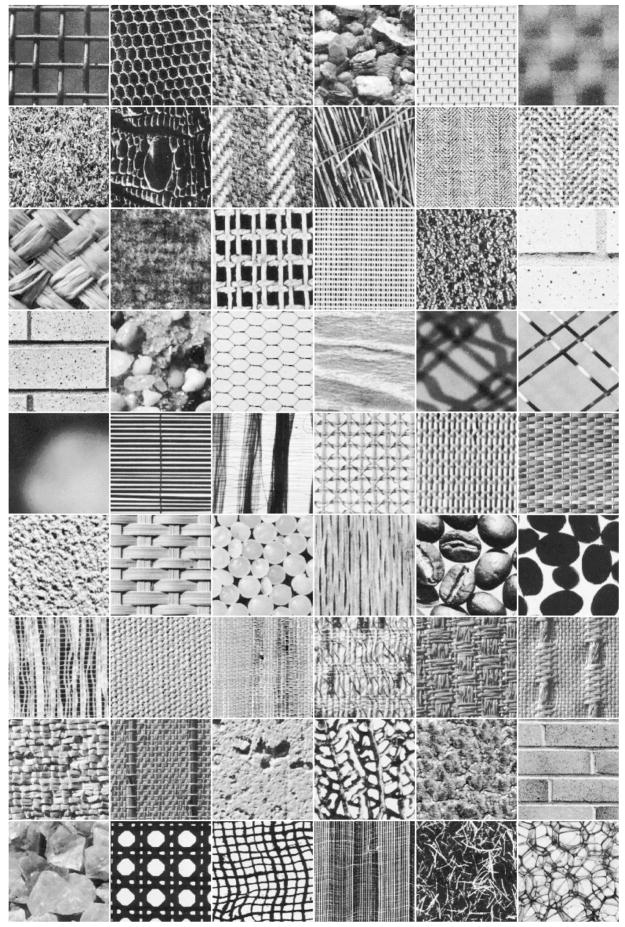
Data set 3 consists of 54 texture images of size 512×512 from the Brodatz album. These texture images are displayed in Fig. 11. The training and testing sets were created in the same way as for data set 1. So we have a total of 864 (54×16) images for training and 3,456 (54×4×16) images for testing (20% for training and 80% for testing). The experiments were also done in the same way as for data set 1. Table III shows the CCPs using four different wavelet bases and different number of neighbors for k-NN classifier. As shown in this table, the maximum CCP is 95.6%. Comparing with the results of data set 1, we can see that by increasing the number of textures from 25 to 54, the maximum CCP has dropped only 2.3%. Note that the training set consists of 16 nonoverlapping subimages of the 512×512 images from Brodatz album. This means that different versions of the textures seen in 128×128 subimages of the 512×512 original image are included in the training set. The testing set is created by the same 512×512 texture images sampled at different orientations and locations. The k-NN classifier finds closest samples in the training set to the testing texture, which will be from the correct class as long as there is not a closer sample from the other texture types. This is the case most of the time and thus the classification rate is high. As shown in Table III, similar properties of CCPs discussed for data set 1 (when we change number of neighbors, the wavelet bases, and the energy features) are valid for data set 3.
Fig. 11.
Fifty-four textures from the Brodatz album used in this study.
TABLE III.
The correct classification percentages for data set 3 using different wavelet bases, feature sets, and k values for k-NN classifier
|
k |
|||||||||||
|---|---|---|---|---|---|---|---|---|---|---|---|
| Wavelet Bases | Features | 1 | 3 | 5 | 7 | 9 | 1 | 3 | 5 | 7 | 9 |
| Before Weight | After Weight | ||||||||||
| db2 | e1 | 87.6 | 88.9 | 88.5 | 88.5 | 87.6 | 89.8 | 90.0 | 89.8 | 89.4 | 89.5 |
| e2 | 57.2 | 59.5 | 61.1 | 62.7 | 63.0 | 77.2 | 78.5 | 79.2 | 79.6 | 80.3 | |
| e1&e2 | 86.5 | 87.7 | 88.3 | 88.7 | 88.8 | 94.4 | 95.2 | 95.6 | 95.2 | 95.0 | |
|
| |||||||||||
| db4 | e1 | 86.1 | 86.9 | 86.8 | 86.7 | 86.4 | 87.9 | 88.2 | 87.9 | 88.1 | 87.8 |
| e2 | 58.6 | 59.1 | 61.1 | 61.7 | 62.1 | 77.9 | 79.7 | 81.6 | 82.0 | 82.0 | |
| e1&e2 | 86.2 | 87.4 | 88.2 | 88.1 | 88.3 | 93.8 | 94.5 | 95.0 | 94.7 | 94.3 | |
|
| |||||||||||
| db6 | e1 | 87.2 | 87.6 | 87.5 | 87.3 | 87.3 | 88.9 | 89.0 | 89.1 | 88.3 | 88.2 |
| e2 | 55.2 | 56.2 | 56.7 | 58.7 | 59.4 | 74.5 | 77.2 | 78.6 | 78.9 | 79.0 | |
| e1&e2 | 83.3 | 84.6 | 84.8 | 85.2 | 85.2 | 93.4 | 94.2 | 94.3 | 94.3 | 94.0 | |
|
| |||||||||||
| db12 | e1 | 86.1 | 86.8 | 87.2 | 86.9 | 86.9 | 87.0 | 87.8 | 87.9 | 88.0 | 87.1 |
| e2 | 38.6 | 40.6 | 41.9 | 43.9 | 45.2 | 66.6 | 68.9 | 70.6 | 71.7 | 72.1 | |
| e1&e2 | 76.9 | 79.6 | 80.3 | 80.5 | 80.2 | 93.1 | 93.9 | 94.3 | 94.0 | 94.0 | |
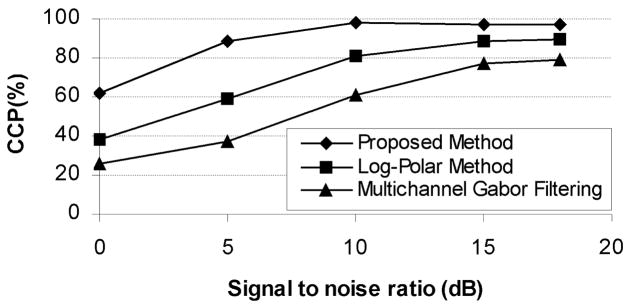
To examine the robustness of the proposed method to additive noise, we carried out experiments using data set 1, db6 wavelet, features e1&e2, and additive white Gaussian noise with zero mean and a variance dependent on the required signal to noise ratios (SNR’s). The results are displayed in Fig. 12. To compare with the most recent rotation invariant techniques in the literature, we have shown the correct classification percentages using Log-polar wavelet signatures and multichannel Gabor filtering as reported in [12]. Although a direct comparison with the results of the method presented in [12] is not possible due to the difference between the classifiers, the sensitivity of the methods to white noise can be compared. As shown in this figure, the proposed method has significantly higher robustness to additive white noise.
Fig. 12.
Performance of three different methods; the average of CCPs using e1&e2 over k=1,3,5,7, and 9 for k-NN classifier, Log-Polar wavelet energy signatures, and multichannel Gabor filtering, for different signal to noise ratios. The texture images are subjected to different levels of white Gaussian noise.
V. Conclusion and Discussion
We have introduced a new technique for rotation invariant texture analysis using Radon and wavelet transforms. In this technique, the Radon transform is calculated for a disk area inside the image and then the wavelet transform is employed to extract the frequency components and calculate the features. We showed some interesting properties of the proposed method including that the extracted features are uncorrelated if we use an orthogonal wavelet transform. The derived features were shown to be invariant to rotation and robust to additive white noise. A k-NN classifier was used to classify each texture to an appropriate class. We did a comparison with two of the most recent rotation invariant texture analysis techniques. Experimental results showed that the proposed method is comparable to or outperforms these methods while using a smaller number of features.
In future, methods to make the proposed technique robust to illumination, non-uniformities/spatial variations can be investigated. We did extra experiments to see how illumination affects the performance of this method. Using the textures used in [4] with illumination “inca” at angle 0° as training set, and all the angles at illuminations “tl84” and “horizon” separately as testing sets, we obtained the maximum of 87.8% CCP for “horizon” illumination using db6 wavelet, compared to 87.0% in [4], and maximum of 83.2% CCP for ‘tl84’ illumination, compared to 90.2% in [4].
Acknowledgments
This work was supported in part by the National Science Foundation (NSF) under Grant BES-9911084 and National Institute of Health (NIH) under Grant R01-EB002450.
Biographies
Kourosh Jafari-Khouzani was born in Isfahan, Iran in 1976. He received his BS degree in electrical engineering from Isfahan University of Technology, Isfahan, Iran, in 1998, his MS degree in the same field from University of Tehran, Tehran, Iran, in 2001. He is currently a PhD student at Wayne State University, Detroit, MI. His research interests include computer vision, medical imaging, and image processing.

Hamid Soltanian-Zadeh (S’89, M’92, SM’00) was born in Yazd, Iran in 1960. He received BS and MS degrees in electrical engineering: electronics from the University of Tehran, Tehran, Iran in 1986 and MSE and PhD degrees in electrical engineering: systems and bioelectrical science from the University of Michigan, Ann Arbor, Michigan, USA in 1990 and 1992, respectively. Since 1988, he has been with the Department of Radiology, Henry Ford Health System, Detroit, Michigan, USA, where he is currently a Senior Staff Scientist. Since 1994, he has been with the Department of Electrical and Computer Engineering, the University of Tehran, Tehran, Iran, where he is currently an Associate Professor. His research interests include medical imaging, signal and image reconstruction, processing, and analysis, pattern recognition, and neural networks.

Footnotes
Recall that in simple polar coordinate system, as we move away from the origin, intensities change more quickly as θ changes.
Contributor Information
Kourosh Jafari-Khouzani, Image Analysis Laboratory, Radiology Department, Henry Ford Health System, Detroit, MI 48202 USA and also with the Department of Computer Science, Wayne State University, Detroit, MI 48202 USA (phone: 313-874-4378; fax: 313-874-4494; e-mail: kjafari@rad.hfh.edu).
Hamid Soltanian-Zadeh, Image Analysis Laboratory, Radiology Department, Henry Ford Health System, Detroit, MI 48202 USA and also with the Control and Intelligent Processing Center of Excellence, Electrical and Computer Engineering Department, Faculty of Engineering, University of Tehran, Tehran, Iran (e-mail: hamids@rad.hfh.edu).
References
- 1.Zhang J, Tan T. Brief review of invariant texture analysis methods. Pattern Recognition. 35:735–747. 2002. [Google Scholar]
- 2.Davis LS. Polarogram: a new tool for image texture analysis. Pattern Recognition. 13(3):219–223. 1981. [Google Scholar]
- 3.Pietikainen M, Ojala T, Xu Z. Rotation-invariant texture classification using feature distributions. Pattern Recognition. 33:43–52. 2000. [Google Scholar]
- 4.Ojala T, Pietikainen M, Maenpaa T. Multiresolution gray-scale and rotation invariant texture classification with local binary patterns. IEEE Trans Pattern Anal Machine Intell. 2002 July;24(7):971–987. [Google Scholar]
- 5.Kashyap RL, Khotanzad A. A Model-Based Method for Rotation Invariant Texture Classification. IEEE Trans Pattern Anal Machine Intell. 1986;8:472–481. [Google Scholar]
- 6.Mao J, Jain AK. Texture classification and segmentation using multiresolution simultaneous autoregressive models. Pattern Recognition. 25(2):173–188. 1992. [Google Scholar]
- 7.Cohen FS, Fan Z, Patel MA. Classification of rotated and scaled textured images using Gaussian Markov random field models. IEEE Trans Pattern Anal Machine Intell. 1991 Feb;13(2):192–202. [Google Scholar]
- 8.Chen J-L, Kundu A. Rotation and gray scale transform invariant texture identification using wavelet decomposition and hidden Markov model. IEEE Trans Pattern Anal Machine Intell. 1994 Feb;16(2):208–214. [Google Scholar]
- 9.Ravichandran G, Trivedi MM. Circular-Mellin features for texture segmentation. IEEE Trans Image Processing. 1995 Dec;4(12):1629–1640. doi: 10.1109/83.475513. [DOI] [PubMed] [Google Scholar]
- 10.Lizhi W, Healey G. Using Zernike moments for the illumination and geometry invariant classification of multispectral texture. IEEE Trans Image Processing. 7(2):196–203. 1998. doi: 10.1109/83.660996. [DOI] [PubMed] [Google Scholar]
- 11.Greenspan H, Belongie S, Goodman R, Perona P. Rotation invariant texture recognition using a steerable pyramid. Proc. Int. Conf. on Pattern Recognition, Conference B: Computer Vision & Image Processing; 1994. pp. 162–167. [Google Scholar]
- 12.Pun CM, Lee MC. Log-polar wavelet energy signatures for rotation and scale invariant texture classification. IEEE Trans Pattern Anal Machine Intell. 2003 May;25(5):590–603. [Google Scholar]
- 13.Manthalkar R, Biswas PK, Chatterji BN. Rotation and scale invariant texture features using discrete wavelet packet transform. Pattern Recognition Letters. 24:2455–2462. 2003. [Google Scholar]
- 14.Charalampidis D, Kasparis T. Wavelet-based rotational invariant roughness features for texture classification and segmentation. IEEE Trans Image Processing. 2002 Aug;11(8):825–837. doi: 10.1109/TIP.2002.801117. [DOI] [PubMed] [Google Scholar]
- 15.Haley GM, Manjunath BS. Rotation-invariant texture classification using a complete space-frequency model. IEEE Trans Image Processing. 8(2):255–269. 1999. doi: 10.1109/83.743859. [DOI] [PubMed] [Google Scholar]
- 16.Wu WR, Wei SC. Rotation and gray-scale transform-invariant texture classification using spiral resampling, subband decomposition, and hidden Markov model. IEEE Trans Image Processing. 1996 Oct;5(10):1423–1434. doi: 10.1109/83.536891. [DOI] [PubMed] [Google Scholar]
- 17.Do MN, Vetterli M. Rotation invariant characterization and retrieval using steerable wavelet-domain hidden Markov models. IEEE Trans Multimedia. 2002 Dec;4(4):517–526. [Google Scholar]
- 18.Magli E, Lo Presti L, Olmo G. A pattern detection and compression algorithm based on the joint wavelet and Radon transform. Proc. IEEE 13th Int. Conf. Digital Signal Processing; 1997. pp. 559–562. [Google Scholar]
- 19.Warrick AL, Delaney PA. Detection of linear features using a localized Radon transform with a wavelet filter. Proc. ICASSP; 1997. pp. 2769–2772. [Google Scholar]
- 20.Leavers VF. Use of the two-dimensional Radon transform to generate a taxonomy of shape for the characterization of abrasive powder particles. IEEE Trans Pattern Anal Machine Intell. 2000 Dec;22(12):1411–1423. [Google Scholar]
- 21.Do MN, Vetterli M. The finite ridgelet transform for image representation. IEEE Trans Image Processing. 2003 Jan;12(1):16–28. doi: 10.1109/TIP.2002.806252. [DOI] [PubMed] [Google Scholar]
- 22.Jean-Luc Starck EJ, Candes, Donoho DL. The curvelet transform for image denoising. IEEE Trans Image Processing. 2002 June;11(6):670–684. doi: 10.1109/TIP.2002.1014998. [DOI] [PubMed] [Google Scholar]
- 23.Bracewell, Ronald N. Two-Dimensional Imaging. Englewood Cliffs, NJ: Prentice Hall; 1995. [Google Scholar]
- 24.Mallat S. A wavelet tour of signal processing. Academic Press; 1999. [Google Scholar]
- 25.Pesquet JC, Krim H, Carfantan H. Time-invariant orthonormal wavelet representation. IEEE Trans Signal Processing. 1996 Aug;44:1964–1970. [Google Scholar]
- 26.Chang T, Kuo CCJ. Texture analysis and classification with tree-structures wavelet transform. IEEE Trans Image Processing. 2003 Oct;2(4):429–441. doi: 10.1109/83.242353. [DOI] [PubMed] [Google Scholar]
- 27.Kim ND, Udpa S. Texture classification using rotated wavelet filters. IEEE Trans Syst, Man, Cybern A. 2000 Nov;30(6):847–852. [Google Scholar]
- 28.Gose E, Johnsonbaugh R, Jost S. Pattern Recognition and Image Analysis. NJ: Prentice Hall; 1996. [Google Scholar]
- 29.Brodatz P. Texture: A Photographic Album for Artists and Designers. New York: Dover; 1966. [Google Scholar]
- 30.http://www.outex.oulu.fi/


