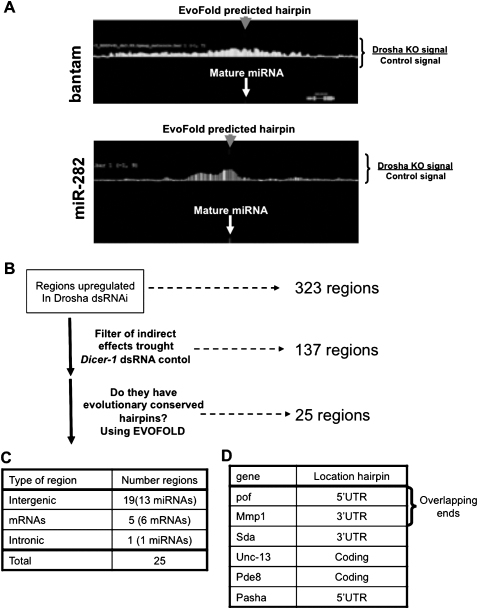
FIGURE 4.
Prediction of hairpins with secondary structure in drosha-regulated RNAs. (A) The graph represents the difference in expression between S2 cells treated with control (luciferase) or drosha dsRNA in the genomic region that contains bantam (top) or miR-282 (bottom). The white arrows indicate the genomic location of the mature miRNAs. The gray arrows indicate the genomic location of the hairpins predicted by evofold for these genomic regions. (B) Schematics of the analysis performed (see Results and Materials and Methods). (C) Genomic location of the 25 putative direct drosha targets obtained after the analysis described in B. (D) Six mRNAs listed are putative direct drosha targets and contain an evofold predicted hairpin in their mature transcript.

