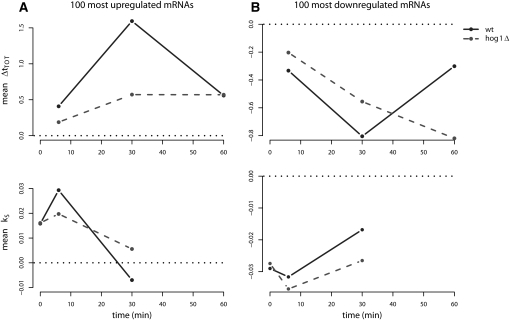
FIGURE 3.
Hog1 affects both steady-state levels and stability. Average stability index (k S) and steady-state log-fold changes (Δt TOT) of the 100 most up-regulated (A) and down-regulated (B) genes at the steady-state level at 30 min in the wild type against time in wt and hog1Δ cells. Zero on the y-axis is indicated by a reference line (dotted black). These groups of genes display a distinct temporal pattern where changes in stability precede changes at the steady-state level. Hog1 influences both the changes in stability and at the steady-state level for both groups. Two-sample t-tests were used to calculate P-values for the average differences between the strains in all panels (see Materials and Methods).

